What Are Pink Sheet Stocks? By Chris Hamilton , eHow Contributor Most public companies trade on the major stock exchanges, including the New York Stock Exchange (NYSE), the Nasdaq and the American Stock Exchange (AMEX), but some stocks do not meet the listing requirements of these exchanges. These pink sheet stocks are traded over the counter (OTC) using an electronic quotation system hosted by the OTC Markets Group. Read more: http://www.ehow.com/info_8148945_pink-sheet-stocks.html#ixzz3467Lg4Eu Read more: http://www.ehow.com/info_8148945_pink-sheet-stocks.html#ixzz3467D8aHD
Japan Food Prices Set To Soar As Government Hikes Wholesale Wheat Prices By 10% Submitted by Tyler Durden on 02/28/2013 13:30 -0500 Central Banks China Japan Nikkei Reality Trade War Yen If the past three months have been any indication of what Japan has to look forward to from Abenomics, we have a feeling his tenure will be as short, if not shorter, than all of his recent (and numerous, among which he, himself) predecessors. Because while the stock market may have risen in lock step with the plunge in the Yen, what has also soared are costs. And while a very select few benefit from the transitory surge in the Nikkei, the rising costs, i.e., inflation, hit everyone equally. Presenting this visually: the USDJPY and Nikkei correlation, which is 1:1 - this is the good news (for some ) Again, " for some ": And the flip side, as shown before , soaring energy costs - this is the bad news (for all ): As all of this happens, Japanese exports - the sole purported reason for this whole reflationary experiment, as the only way the economy improves is if Japan exports soar and the country returns to a net trade surplus status, just hit a record deficit as of a few days ago: But while the "no free lunch" reality has until now mostly been felt by those who need energy, as shown in " You Wanted Inflation, You Got It: Japanese Gasoline Price Rises To Eight Month High " the inflationary impact on Chinese imports is about to hit everyone like a sledgehammer right where it hurts the most: in the stomach, as the inevitable has finally happened, and the agriculture ministry announced that wholesale wheat prices are set to rise by a near-record 9.7% in April, which will shortly thereafter send regular food prices soaring. From Japan Times : The agriculture ministry said Wednesday it will raise wholesale prices for five imported wheat varieties by an average of 9.7 percent to 54,990 yen per ton in April , the second rise since October, due to higher international market prices and the yen's depreciation . The yen's decline triggered by the policy of the government of Prime Minister Shinzo Abe formed in December has pushed up prices 2 percent, and new prices to become effective in October might get even higher if the Japanese currency remains weak, the Ministry of Agriculture, Forestry and Fisheries said. This is only the second highest increase in wheat prices in history, with the only greater one taking place during the great inflation scare of early 2011, when even China got its brush with the "spring" movement that toppled all North African dictators. The rate of increase in April is the second steepest after the 18 percent notched in April 2011 . What food will be impacted? Pretty much anything with wheat in it. And anyone hoping that the deep-pockted government would sibsidize producers (and thus force the entrance into a trade war), will be disappointed: the prices will all be passed on to the consumer. Of five main wheat varieties, two for use in udon noodles and confection will become 14.2 percent more expensive. The prices for the remaining three varieties used in bread and Chinese noodles will jump 7.5 percent, making it likely that price hikes will be passed onto consumers. Following the ministry's announcement, Nippon Flour Mills Co. said it will consider raising its charges . Other milling firms that produce wheat for industrial and retail use are also expected to follow suit. The government buys all imported wheat, on which Japan relies for 90 percent of its consumption, and revises the prices twice a year -- in April and October. And just like that Japan is about to learn that soaring stock prices always have a trade off, a lesson which even GETCO's SP ramping algos will not be exempt from when the latest bout of soaring food inflation results in central banks scrambling to withdraw liquidity, just as they did in early 2011. The results will naturally be the same. As for how long Abe's government will remain in power after energy and food inflation sweep through the net importing nation, that is anyone's guess. Average: 5 Your rating: None Average: 5 ( 6 votes)
What If Corporate Earnings Have Topped Out? Submitted by Tyler Durden on 01/08/2013 10:13 -0500 Bear Market CPI ETC Gross Domestic Product Guest Post Medicare Unemployment Via Charles Hugh-Smith of OfTwoMinds blog , The market may have reached cyclical highs in corporate earnings. That does not bode well for additional stock market advances. If corporate earnings have topped out, what will push the stock market higher? The usual answer is "central bank intervention," but history suggests that in the long run, the market eventually correlates to corporate earnings. Earnings up, market up; earnings down, market down. Frequent contributor B.C. recently shared some insightful charts of SP 500 (SPX) earnings. Here are B.C.'s comments on the first chart: Note that real earnings (CPI adjusted) in '09 fell to the levels of the 1920s-30s, 1890s, and 1870s, and to the levels of the 1970s in nominal terms. A "typical" cyclical decline would take earnings back to the long-term trend from 1932 and the log trend line at $40s-$50s from $87 today. Also, recall that the Fortune 300 firms have revenues equivalent to 50% to 100% of private GDP at $425,000/employee, so they are the economy. A decline of 50% for profits would be the equivalent of 10% of private GDP, which would match or exceed the decline in '08-'09, risking an increase in the Unemployment rate of 50-100% and a fiscal deficit exceeding 100% of tax receipts after Social Security and Medicare receipts. The next two charts track long-term historic trends: here is B.C.'s commentary: Reported earnings of the SP 500 (SPX) are highly cyclical with a periodicity of ~51 months. Earnings are contracting year-over-year (yoy) as occurred in late '07 and early '08, early '01, etc. Profits as a percentage of GDP at 10-11% are 65-70% above the historical average and 130% above the historical average during recessions and bear market troughs, implying the risk of up to a 55-60% decline in profits and profits as a percentage of GDP, i.e., a roughly $1 trillion decline or an equivalent of 10% of private GDP. The 10-yr. average P/E and 16- and 20-year real changes and real total returns to date for the secular bear market imply the risk of a crash at some point in the next 1/2 to 4 years and no real change to the SP 500 for 20 years, indicating just how grossly overvalued stock prices are historically. Thank you, B.C. for the charts and incisive commentary. Is it mere coincidence that the SPX has doubled over the past four years as corporate profits soared? If we haven't yet reached the 51-month cycle peak, we are certainly close. What happens to the post-QE market if earnings decline? 4th Quarter Earnings Will be an Unmitigated Disaster (EconMatters) Average: 4.5 Your rating: None Average: 4.5 ( 4 votes)
Presenting The Fundamental Flaw In The Fed's Thinking Submitted by Tyler Durden on 06/20/2012 15:15 -0400 This one simple chart below shows what is possibly the biggest and most fundamental flaw in Bernanke's approach to spurring the economy, which to him, of course, means rising prices of risky assets, aka the stock market. The chart above shows the return of two simple things: the return of 4.25% 30 Year Bond issued November 2010... and the SP. As is vividly shown on the chart, the return of the long-bond is nearly three times greater than that of the broader equity market in 18 short months! And therein, ladies and gentlemen, lies the rub. Recall that Bernanke said something substantively as follows: "When our policy response lowers interest rates on govt bonds, it induces market participants to take more risk. Someone selling their govt bond to us may go out and buy a corp bond, thereby lowering spreads. A bank selling their govt bond to us may go out and make a loan..." There is one problem with this logic: it is dead wrong. Because instead of forcing investors to rush out of the bond market, which potentially has much more upside embedded (the 30 Year is yielding 2.7% right now: this means the actual price of the 30 Year can continue going up and up and up), investors, even those "sophisticated" ones at banks, hedge funds, and prop desks who can trade CDS, IR Swaps, variance swaps, swaptions, and things the retail investor has never heard of, are doing something else, and something much simpler, entirely. They are simply front-running the Fed! The Fed's entire policy of boosting the economy is a failure for many reasons, but the primary purpose embedded therein - to lift stock markets, will forever be subordinated (to use the parlance of our times) to just frontrunning the Fed, which simply means buy whatever the Fed is buy, and sell whatever (if anything) it is selling. In simpler format: Frontrun what the Fed has publicly telegraphed to be doing ... Profit And as long as the Fed continues on the course of LSAP, either unsterilized or sterilized ala Twist, this will continue, and the Fed will continue failing upward. Sadly, this also means that at the end the Fed has only one option: to go Japanese and start buying not only REITs and ETFs, but ultimately individual stocks. At that point the best purchase, however will not be the stock market, but wheelbarrows.
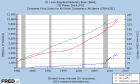
On Inflation, M2, and the Velocity of Money Submitted by CrownThomas on 08/10/2012 11:46 -0400 We often hear that the central banks printing money in order to keep the stock market inflated and broke countries afloat for just a few days longer is nothing to worry about. The reason we are given, is that even though the central banks are pumping trillions into the economy, inflation isn't an issue. And after all, the velocity of money has actually declined. That's the message from the "smart" people anyway. This chart shows that as M2 grows (Red), so does inflation ie: CPI (Green) - yes, this is the government's calculation, we'll leave it there for this chart's purpose. Also of note is the monetary base without the banking ponzi scheme of fractional reserve banking (Blue). So as you can see, inflation actually follows M2 growth, even as the velocity of money (below) declines. Don't be fooled by those who tell you that printing money isn't causing inflation, because it is doing just that each and every day. There are those who believe that velocity of money is a product of fast growing inflation (not a cause) . Inflation has been rising consistently with the growth in money supply, but the velocity of money has declined. You can imagine what happens once velocity of money actually starts to turn (hint: something ZH has been warning about for years). Similar Articles You Might Enjoy: Guest Post: Why QE Won't Create Inflation Quite As Expected On Gold As A Hyperinflation Put Jobless Claims Spike Is Fourth Largest In 2012 As Producer Prices Surge By Most Since June 2009 The Monetary Endgame Score To Date: Hyperinflations: 56; Hyperdeflations: 0 UBS Issues Hyperinflation Warning For US And UK, Calls It Purely "A Fiscal Phenomenon"
disabled. Guest Post: As M2 Money Supply Rolls Over, The Stock Market Will Follow Submitted by Tyler Durden on 07/11/2012 11:37 -0400 Submitted by Charles Hugh Smith from Of Two Minds As M2 Money Supply Rolls Over, the Stock Market Will Follow M2 money supply rose sharply, driving the stock market higher. Now it has peaked and rolled over. That does not bode well for the Bull market. Our Chartist Friend from Pittsburgh kindly shared a chart of M2 money supply and the SP 500 stock market index (SPX). The correlation between expansion of the money supply and the stock market is worth studying. The primary point is that “real growth,” i.e. rising wages and profits powered by increases in productivity, does not require massive growth of M2. Here is Chartist Friend from Pittsburgh's explanatory commentary : "He who controls the money supply of a nation controls the nation." President James A. Garfield Except during periods of exceptional earnings growth like we had during the pre-internet computer boom when companies like Microsoft, Oracle and Intel were improving business productivity by leaps and bounds, the trend of the stock market (and economic growth in general) tends to closely follow changes in Fed controlled money supply growth. The outlier earnings growth of the 1980's and early 90's PC and database revolution was so strong that the Fed was able to take its foot off the monetary accelerator without causing a corresponding drop in stock prices. Once every business was fully computerized in the mid 90's the Fed floored it again to support stocks and create the Internet Bubble. Since then every time the Fed has taken its foot off the M2 accelerator the market trend has turned negative and the economy has gone into recession. That appears to be what is happening right now. Note the clear correlation of the 1987 crash and the breakdown from a 20-year dome-top of M2 growth that occurred during the late 80's. The two downtrend lines are parallel on the chart. Thank you, Chartist Friend from Pittsburgh . As many observers have noted, you can expand the money supply but if that money ends up stashed as bank reserves, it never enters the real economy, nor does it flow into household earnings. The velocity of that "dead money" is near-zero. M2 declined in the housing bubble as the velocity of money skyrocketed: everyone was pulling money out of housing equity via HELOCs (home equity lines of credit) and spending the "free money" on cruises, furniture, big-screen TVs, boats, fine dining, etc. The recipients of that spending also borrowed and spent as if the "free money" would never end. If M2 expansion is the only thing propping up an artificial market, what happens to the stock market rally as M2 rolls over?
Many Americans are not buying the recent stock market rally. This is being reflected in multiple polls showing negative attitudes towards the economy and Wall Street. Wall Street is so disconnected from the average American that they fail to see the 27 million unemployed and underemployed Americans that now have a harder time believing the gospel of financial engineering prosperity. Americans have a reason to be dubious regarding the recovery because jobs are the main push for most Americans. A recent study shows that over 70 percent of Americans derive their monthly income from an actual W-2 job. In other words, working is the prime mover and source of their income. Yet the financial elite have very little understanding of this concept. Why? 42 percent of financial wealth is controlled by the top 1 percent. We would need to go back to the Great Depression to see such lopsided data. Many Americans are still struggling at the depths of this recession. We have 37 million Americans on food stamps and many wait until midnight of the last day of the month so checks can clear to buy food at Wal-Mart . Do you think these people are starring at the stock market? The overall data is much worse: Source: William Domhoff If we break the data down further we will find that 93 percent of all financial wealth is controlled by the top 10 percent of the country. That is why these people are cheering their one cent share increase while layoffs keep on improving the bottom line. But what bottom line are we talking about here? The Wall Street crowd would like you to believe that all is now good that the stock market has rallied 60+ percent. Of course they are happy because they control most of this wealth. Yet the typical American still has negative views on the economy because they actually have to work to earn a living: The above daily poll asks Americans about their view on the health of the economy. Only 13 percent believe the economy is good or excellent. Funny how that correlates with the top 10 percent who control 93 percent of wealth. Many Americans were sold the illusion of the bubble. They were sold on the idea that their homes were worth so much more than they really were. And many used this phony wealth effect to go out and spend beyond their means. They started spending as if they were part of this elite 10 percent crowd. But once the tide rolled out, it was clear they were not. And the horribly built bailouts demonstrate who is controlling our political system. This was not the rule of a capitalist system but a corporate run government . Just think about the bailouts and which companies were saved. We ended up bailing out the worst performing and troubled companies thus keeping alive companies that should have completely failed. Did we bail out Google? Proctor and Gamble? Of course not. These companies actually produce something that people want. Banks and especially the Wall Street kind merely keep that 42 percent happy by making sure their stock values stay high so they can keep on making money while the average Americans is sold up the river. Yet many were brought into the easy money fold by going into massive amounts of debt. And who has most of the debt? That is right, the average American : The bottom 90 percent have been saddled with 73 percent of all debt. In other words much of their so-called wealth is connected to debt. Debt is slavery for many especially with egregious credit card companies taking people out with absurd credit card tricks and scams . Yet the corporate propaganda machine is strong and mighty. Have you ever received an inheritance? A large one? Probably not because only 1.6% of all Americans receive an inheritance larger than $100,000. If this is the case, why in the world do politicians worry so much about the tax impacts of this? Because they want to keep the corporatocracy alive and well so their spawn can get a piece of their pie. They give the illusion to average Americans that if you only work hard enough you too can join this elusive club of cronies. The data shows otherwise. But if we start looking at investment assets, the true wealth in the country, we start realizing why Wall Street is all giddy about the recent stock market government induced rally: Of investment assets 90 percent of Americans own 12.2 percent. The rest goes to the top 10 percent. Welcome to the new serfdom. The bailouts that went out to the filthy rich were more about protecting their tiny corner of the world than actually making the economy better. That is why it is interesting to see companies fire people and Wall Street cheer for the increase in earnings per share. Good for the few at the expense of the many. Yet the propaganda out of Wall Street and our government is what is good for Wall Street is good for you. Just like that 1.6% inheritance issue, the vast majority of Americans won’t deal with that and their primary concern is simply a job. A job that has provided stagnant wages for a decade while the ultra wealth get richer and richer in a phony form of corporate socialism. If you break down the data you realize that most Americans don’t have time to speculate in stock markets: Only 34% of U.S. households make more than $65,000 per year. What is that after taxes? Let us use a state like California for example: Now if we breakdown this data further you will realize that most of the money is consumed by cost of living necessities, not Wall Street speculation. Just to show this example let us look at a family budget for someone in California making $100,000: Notice after running the budget we are in the hole for $1,000? That is because of many costs that typical families have. We can debate the merits of where they are spending money but the point is this; are these people really making beaucoup money from the stock market? They are putting away $12,000 a year into their 401k. As we have now found out, 8 percent a year is never guaranteed in the stock market although the corporate powers would like you to believe that so they can have other suckers to unload stocks onto. “Yet the median household income in the U.S. is $50,000 and not $100,000. They have even less to invest.” They are more concerned on working to have a paycheck to pay for necessities. They are more concerned about paying their house off by the time they retire and hopefully, have a little bit of retirement funds coming in. The sad fact is most Americans rely on Social Security when they retire. All those ads of unlimited golf and daily trips to Tahiti are propaganda of how Wall Street lives and they want to sell you the sizzle, and clearly not the steak. They live their lives paper pushing and sucking the life out of the productive part of our economy. The average American should now realize this since this financial crisis was primarily caused by them. They are now on a massive campaign to blame Americans for this. This is hypocrisy to the next level. Many Americans have paid for their mistake by losing their home through foreclosure. We have 300,000 foreclosure filings a month. Many have taken a hit to their overall stock portfolio (if they have one). Yet the corporate cronies have protected their horrible economy crushing debts at the taxpayer expense. Unlike you, many hold bonds on the companies and not common stock like many Americans. Bondholders have been protected at all costs during this crisis. Goldman Sachs through AIG received 100 cents on the dollar for their horrible bets. The banks have unlimited back stops thanks to taxpayers. This is how the top 1 percent rule the new feudal state. Welcome to the 2010 serfdom. Time to wake up and restructure the system. Many people are starting to wake up to this massive scam. If you enjoyed this post click here to subscribe to a complete feed and stay up to date with today’s challenging market!
 标签: Stock经管大学堂:名校名师名课
 京公网安备 11010802022788号
论坛法律顾问:王进律师
知识产权保护声明
免责及隐私声明
京公网安备 11010802022788号
论坛法律顾问:王进律师
知识产权保护声明
免责及隐私声明


