楼主: zhou.wen
19770 62

[学科前沿] [Z帖]SAS9.4在SAS/Graph中的新特性与SAS9.3对比   [推广有奖]

教授

9%

还不是VIP/贵宾

-

TA的文库  其他...

SAS Technology

威望
0
论坛币
31987 个
通用积分
6.2141
学术水平
283 点
热心指数
262 点
信用等级
257 点
经验
55167 点
帖子
399
精华
4
在线时间
1328 小时
注册时间
2010-10-12
最后登录
2018-3-9

初级学术勋章 初级热心勋章 中级学术勋章 中级热心勋章

+2 论坛币
k人 参与回答

经管之家送您一份

应届毕业生专属福利!

求职就业群
赵安豆老师微信:zhaoandou666

经管之家联合CDA

送您一个全额奖学金名额~ !

感谢您参与论坛问题回答

经管之家送您两个论坛币!

+2 论坛币
Shareing blog about  the ods/graph
https://bbs.pinggu.org/thread-2413951-1-1.htm
execute sas programm by using batch file.
lhttps://bbs.pinggu.org/thread-2349766-1-1.htm
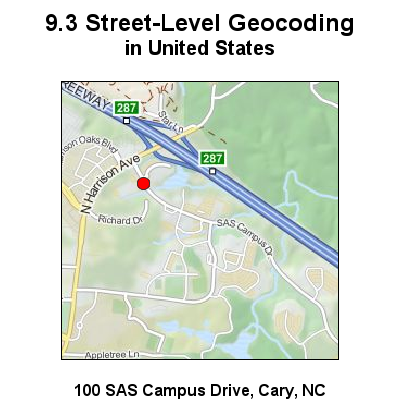
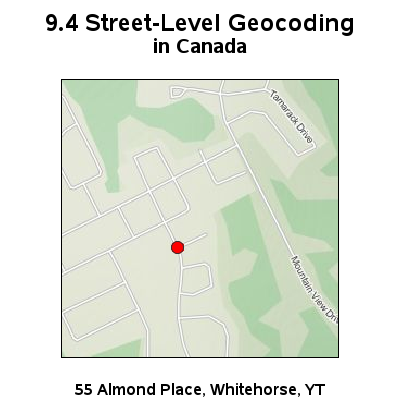
《SAS9.4在SAS/Graph中的新特性与SAS9.3对比》转自
http://www.robslink.com/SAS/democd62/new_94_sas.htm
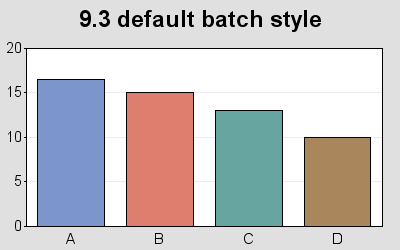
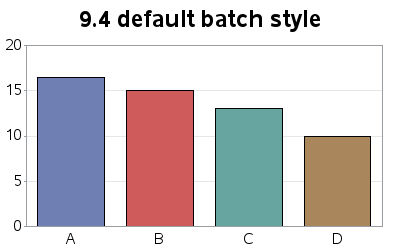
lNew Default Style:
Consistency, consistency, consistency - there's something to be said for that!
When you run SAS/GRAPH in batch mode SAS 9.4, the default ODS Graph style is now 'htmlblue'. The default for interactive DMS SAS was already changed to htmlblue in SAS 9.3, and Enterprise Guide's default has been changed from EGDefault to htmlblue as well. Now you will get more consistent default output, in more situations!
I almost always run my SAS jobs in batch, and always hard-coded a style to over-ride the default - now I no longer have to do that to get an acceptable graph. The htmlblue style makes the graphs easier to read (without the gray background), and should better suit more users.
Note that I don't typically recommend coloring each bar a different color, but I'm doing so in this case so you can easily see what the default colors are, for the default style. Click link to see sas code.


New Graph Styles:
There are two new styles you can use with SAS 9.4 SAS/GRAPH - dove and raven. Unlike some of the older styles such as electronics and science (which are now deprecated), these new styles were designed to work well with ODS Graphics. Click link to see dove sas code and raven sas code.


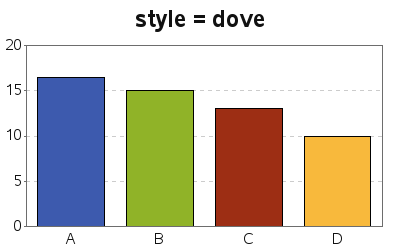
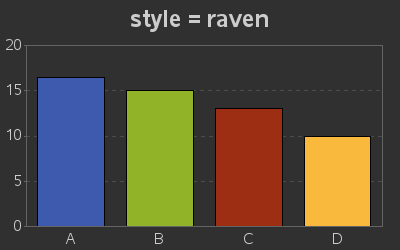
Remember, you can always submit the following code to see the list of supported/recommended ODS Graph styles for whatever version of SAS you're running:
   proc template;   list styles;   run;
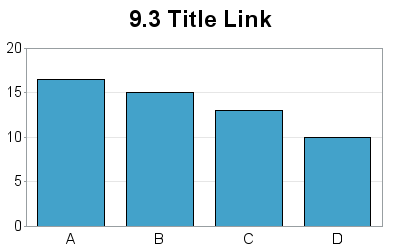
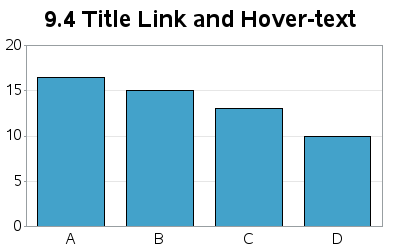


Accessible Titles:
Previously, you could only specify a url link for the graph title. Now in SAS 9.4, you can also specify 'alt' text for the title. Html alt text is useful for adding additional description and details that you don't want to clutter the graph with, but that you want to make available on-demand (when the user hovers their mouse over the title). The alt text in the title also makes the graph more "accessible" to the blind -- for example, JAWS and Apple's VoiceOver can read the alt text to a blind user. Click link to see sas code.
title1 link="http://www.sas.com" alt="descriptive text" "Title Text";Note that you'll need to click on the images/links below, and view the html page for each graph, to try out the links and alt text in the title:


Gif Anti-aliasing:
Back in SAS 9.3 we added support for anti-aliasing (line smoothing) with device=png. Now in SAS 9.4 we've also added that capability to device=gif!
One caveat though is that gif images are still limited to 256 colors (this is a gif limitation, not a SAS limitation) and anti-aliasing will consume a few more colors for the shades of gray. So if you need a lot of colors in your graph, we still recommend you use device=png ... but if you really want a gif, you can now have one with smooth lines. Click link to see sas code.


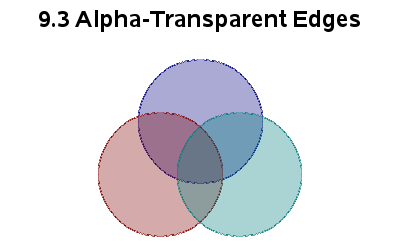
Gif Alpha-transparency:
Back in SAS 9.3 we added support for Alpha Channel Color Transparency in device=png. Now in SAS 9.4, we've also added that capability for device=gif.
The alpha color name syntax is 'Arrggbbaa' where rr, gg, bb are the hex values for the level of red, green, blue (same as before), and aa is the hex values for alpha. An alpha value of 00 is completely transparent, and FF is completely solid. In the V9.4 example below, I use 'A1464F4aa' (blue) and 'AFFFF0077' (yellow) as the colors. Click link to see sas code.


Better GIF Animations:
Previously, you could create nice dev=png graphs, with anti-aliasing and alpha-transparent colors ... but if you wanted a gif animations you had to do without those nice features. Now in SAS 9.3, you can create gif animations with those features! Note that the syntax is a little different (hopefully easier!). Click link to see sas code.


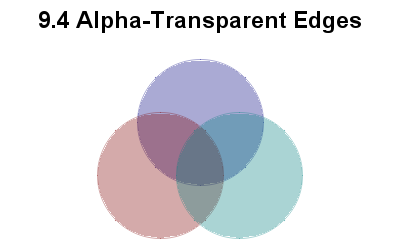
Better Transparency:
SAS 9.3 was the first version of SAS/GRAPH to support alpha-transparency, and it was still a little "rough around the edges" - literally. Notice in the examples below that the 9.3 annotated transparent pies had a dark/rough edge ... whereas they look much better in the 9.4 output. Click link to see sas code.
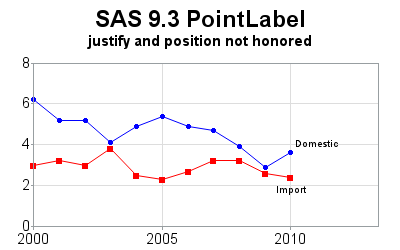
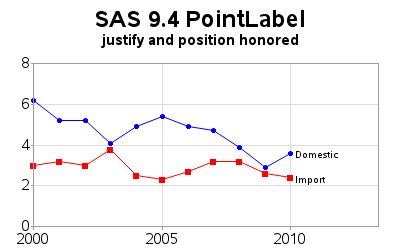


Better Pointlabels:
More options to specify & control the text in pointlabels was added in SAS 9.2 and 9.3. We continue to add even more text-controlling options in SAS 9.4 - this time, this time some options to better control the left/right and up/down placement of the text via 'justify' and 'position' options. Click link to see sas code.


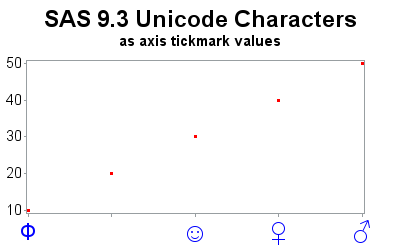
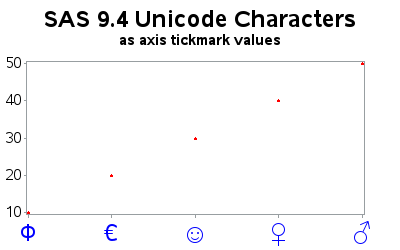
Better Unicode Character Support:
In SAS 9.2, we added support for using Unicode character codes to specify characters in a font. In SAS 9.3 we improved that capability, and in SAS 9.4 we get even closer to perfection! Previously, certain unicode characters didn't work in certain situations (for example, the Euro character '20AC'x in "albany amt/unicode" did not work when used as an axis tickmark value). That capability is now working in SAS 9.4! Click link to see sas code.
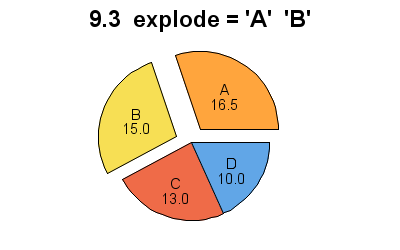
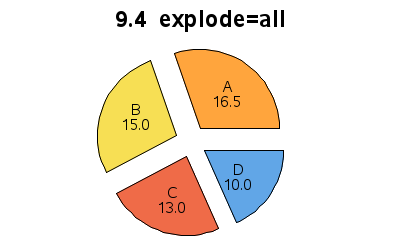


Exploded Pie:
Previously, SAS allowed you to explode pie slices by explicitly specifying the name of the pie slice(s) with the 'explode=' option. If you wanted to explode all the slices, you had to specify them all ... and if the data changed you would have to change your code to specify all the new values. Now if you want to explode all the pie slices, you can use the new 'explode=all' option in SAS 9.4! Click link to see sas code.
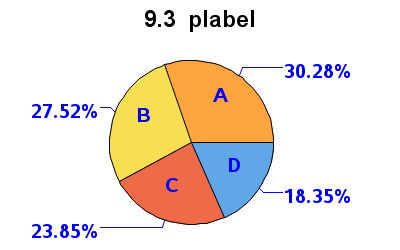
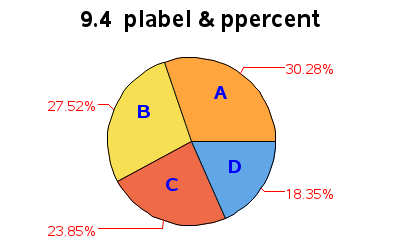


Pie Ppercent:
Previously, you could control the properties of the Proc Gchart pie labels using the 'plabel' option - but these properties got applied to *all* the labels. Now in SAS 9.4, there is a new option called 'ppercent' which lets you control the properties (color, font, and size) of the percent labels separately. Click link to see sas code.
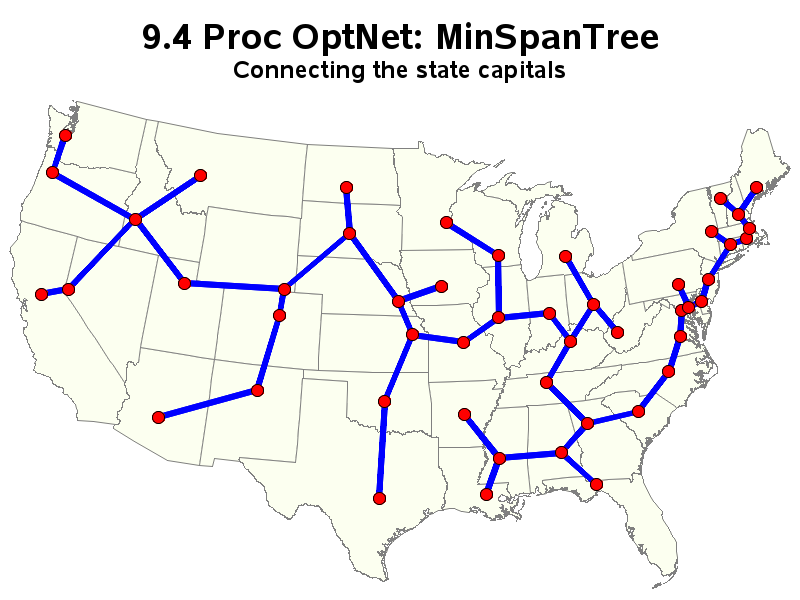
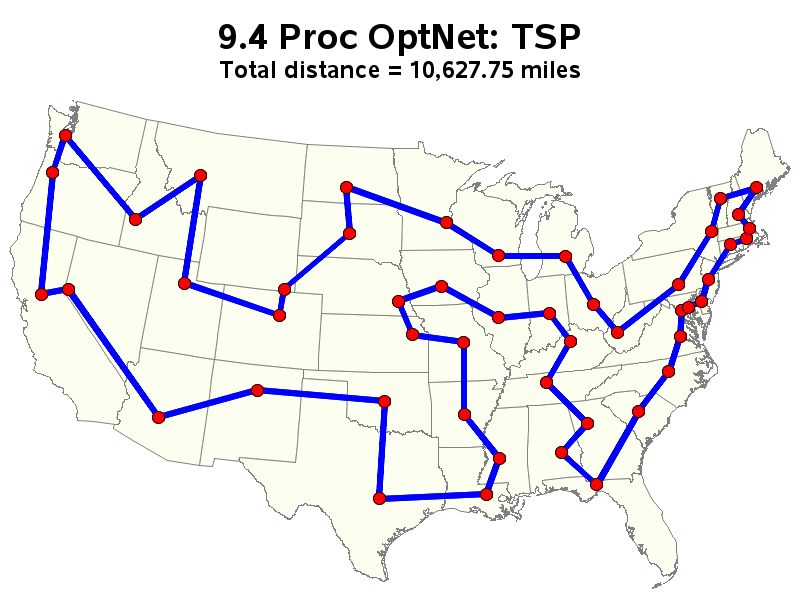
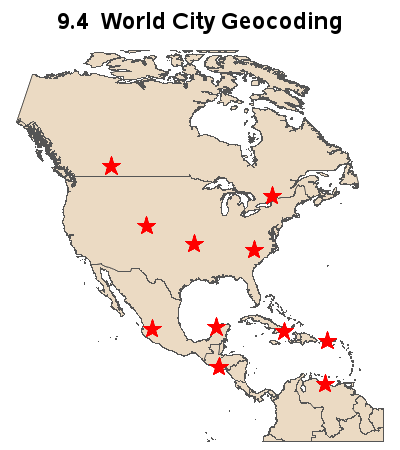


Proc Optnet:
Technically, this is something new in SAS/OR, rather than SAS/GRAPH, but I'd like to mention it here because it ties in so well with Gmap. Proc OptNet was added, which helps you determine optimal ways to connect various locations using algorithms for MinSpanTree, Traveling Salesman Problem (TSP), etc. Click link to see minspantree sas code and tsp sas code.


二维码

扫码加我 拉你入群

请注明:姓名-公司-职位

以便审核进群资格,未注明则拒绝

关键词:GRAPH SAS9 GRAP APH RAP graph

已有 4 人评分经验 学术水平 热心指数 信用等级 收起 理由
liujianfang + 100 分析的有道理
观世鹰 + 100 + 3 + 3 + 3 精彩帖子
reduce_fat + 5 + 5 + 5 分析的有道理
crackman + 100 鼓励积极发帖讨论

总评分: 经验 + 300  学术水平 + 8  热心指数 + 8  信用等级 + 8   查看全部评分

本帖被以下文库推荐

Practice Is The Best Teacher!
沙发
zhou.wen 发表于 2013-5-15 14:51:41 |只看作者 |坛友微信交流群
Annotating Image URL:Previously, you could annotate images on your graphs, but if you wanted to annotate an image that was on the Web you had to first download the image to disk (either manually or via some 'tricky' SAS code), and then reference that disk copy in annotate imgpath variable in your annotate data set. Click link to see 9.3 sas code.
imgpath="C:\somefile.gif";In SAS 9.4, you can now specify the Web URL of the image, and when the SAS code is run it will automatically download and use that image on-the-fly, without storing a permanent copy on your hard drive. Click link to see 9.4 sas code.
imgpath="http:someserver.com/somefile.gif";


New Maps!

Over time, borders and country names change, and we've also come to expect the coordinates to be more 'exact' now that we're combining maps and overlaying lat/long point-data, and so on. Therefore it is with great happiness that I announce the new GFK maps in SAS 9.4!
We still have the old maps in the 'maps' library (aka, "mapssas"). And the new maps are in the "mapsgfk" library. One difference you'll immediately notice is that the names are no longer limited to 8 characters, making the names easier to read (and easier to predict) ... for example, mapsgfk.Kazakhstan versus maps.Kazakhst. Another difference is that the new maps have their unprojected lat/long in eastlong degrees (whereas our previous maps were in westlong radians). And the new maps are more up-to-date, more accurate, and show more detail. The following examples is just a Gplot of the unprojected coordinates in one of the maps. Click this link to see the sas code.


World Cities:

I previous versions of SAS, we shipped a maps.uscity data set which contained the latitude/longitude coordinates of U.S. cities. Now in SAS 9.4, we also ship a data set containing the coordinates of major cities throughout the world (mapsgfk.world_cities). Click link to see 9.3 sas code and the 9.4 sas code.


World City Geocoding:

In SAS 9.3, Proc Geocode could lookup the lat/long for U.S. cities (using sashelp.zipcode). In SAS 9.4, Proc Geocode can lookup the lat/long for cities throughout the world (using mapsgfk.world_cities). Note that there are a few 'gotchas' - for example the spelling of the city names in your data must match the spelling in mapsgfk.world_cities exactly, and those GFK-supplied names are not always the English spelling. We'll probably do some fine-tuning of the world city geocoding in future releases. Click to see the 9.3 sas code. and the 9.4 sas code.


Street-Level Geocoding for Canada:

In SAS 9.3, Proc Geocode could do street-level geocoding for addresses in the United States. Now in SAS 9.4, you can also do street-level geocoding for some addresses in Canada. Click to see the 9.3 sas code. and the 9.4 sas code.


Sample Data for U.S.

In SAS 9.3, if you wanted to create a simple/easy map to experiment with, there was not really any good simple response data to use. Therefore most users simply used the map geometry data set as the response data, and plotted the map 'id' as the response variable. The resulting map was not very meaningful, but this was the only "data" that was easily available.
Now in SAS 9.4, we include sashelp.us_data which contains a variety of real-world response data from the Census, for all the states in the U.S. For example, the following variables are included: division, region, population_2010, and density_2010. This now makes it easy to experiment with Proc Gmap, using meaningful real-world data! Click this link to see the sas code.


ODS Layout

In SAS 9.4, ODS Layout is now *production*!
ODS Layout can be really helpful in creating custom dashboards, info-graphics, and custom reports/documents. It has the advantage over Proc Greplay in that you can mix both graphical proc, and tabular-proc output on the same page, and it will also work with non-traditional graphics procs such as Proc Gtile and Proc SGplot (whereas greplay only works with traditional sas/graph procs such as gplot, gchart, gmap, and gslide). Click this link to see the sas code used for this example.


已有 1 人评分经验 论坛币 收起 理由
webgu + 100 + 100 观点有启发

总评分: 经验 + 100  论坛币 + 100   查看全部评分

Practice Is The Best Teacher!

使用道具

藤椅
biostat 发表于 2013-5-15 14:55:26 |只看作者 |坛友微信交流群
学习啦,希望SAS有更好的表现。

使用道具

板凳
nkunku 发表于 2013-5-15 15:14:56 |只看作者 |坛友微信交流群
天哪,我SAS 9.3才装没多久哇。且SAS越来越难下载了

使用道具

报纸
zhou.wen 发表于 2013-5-15 15:19:51 |只看作者 |坛友微信交流群
nkunku 发表于 2013-5-15 15:14
天哪,我SAS 9.3才装没多久哇。且SAS越来越难下载了
9.4还没出,不用太紧张
Practice Is The Best Teacher!

使用道具

地板
zkymath 在职认证  发表于 2013-5-15 16:20:47 |只看作者 |坛友微信交流群
用8.2都够使,追版本没啥必要

使用道具

7
zhou.wen 发表于 2013-5-15 16:54:34 |只看作者 |坛友微信交流群
zkymath 发表于 2013-5-15 16:20
用8.2都够使,追版本没啥必要
追求版本的确不是必要的,但是墨守成规却是致命的
SAS公司既然花这么大的功夫去完善SAS,从v8到v9,再从v9.1到v9.3,自然有它的原因
作为SAS的忠实用户我是乐于看到SAS软件的不断创新的,有创新才能保持SAS的生命力
因此,追求新版本并不是追求潮流,而已追求创新,与SAS公司共同进步
已有 2 人评分经验 学术水平 热心指数 信用等级 收起 理由
iamthekingofthe + 1 + 1 + 1 我很赞同
webgu + 80 我很赞同

总评分: 经验 + 80  学术水平 + 1  热心指数 + 1  信用等级 + 1   查看全部评分

Practice Is The Best Teacher!

使用道具

8
zkymath 在职认证  发表于 2013-5-15 19:08:32 |只看作者 |坛友微信交流群
够用就是够用,sas也不是万能的,也不是最好的。
适合自用就成了

使用道具

9
zhou.wen 发表于 2013-5-15 20:38:08 |只看作者 |坛友微信交流群
Excellent practice using SAS/Graph
http://www.robslink.com/SAS/Home.htm
已有 1 人评分学术水平 热心指数 信用等级 收起 理由
zll_zh + 1 + 1 + 1 热心帮助其他会员

总评分: 学术水平 + 1  热心指数 + 1  信用等级 + 1   查看全部评分

Practice Is The Best Teacher!

使用道具

10
邓贵大 发表于 2013-5-15 20:47:07 |只看作者 |坛友微信交流群
[Z贴]请注明
我现在确定你不时咱认识的Zhou Wen了
Be still, my soul: the hour is hastening on
When we shall be forever with the Lord.
When disappointment, grief and fear are gone,
Sorrow forgot, love's purest joys restored.

使用道具

您需要登录后才可以回帖 登录 | 我要注册

本版微信群
加好友,备注cda
拉您进交流群

京ICP备16021002-2号 京B2-20170662号 京公网安备 11010802022788号 论坛法律顾问:王进律师 知识产权保护声明   免责及隐私声明

GMT+8, 2024-4-20 13:00