楼主: oliyiyi
1631 3

What Big Data, Data Science, Deep Learning software goes together? [推广有奖]

版主

泰斗

0%

还不是VIP/贵宾

-

TA的文库  其他...

计量文库

威望
7
论坛币
271951 个
通用积分
31269.3519
学术水平
1435 点
热心指数
1554 点
信用等级
1345 点
经验
383775 点
帖子
9598
精华
66
在线时间
5468 小时
注册时间
2007-5-21
最后登录
2024-4-18

初级学术勋章 初级热心勋章 初级信用勋章 中级信用勋章 中级学术勋章 中级热心勋章 高级热心勋章 高级学术勋章 高级信用勋章 特级热心勋章 特级学术勋章 特级信用勋章

+2 论坛币
k人 参与回答

经管之家送您一份

应届毕业生专属福利!

求职就业群
赵安豆老师微信:zhaoandou666

经管之家联合CDA

送您一个全额奖学金名额~ !

感谢您参与论坛问题回答

经管之家送您两个论坛币!

+2 论坛币
Last week, I reported the results of 2016 KDnuggets Software Poll: R, Python Duel As Top Analytics, Data Science software.

This post looks a little deeper and examines the associations between different tools, their relationship to Big Data and Deep Learning, and regional patterns. At the end of the post there is a link to anonymized dataset, so that you can do your own analysis (and let me know about the results in comments below).

The question asked in KDnuggets Poll was
What software you used for Analytics, Data Mining, Data Science, Machine Learning projects in the past 12 months?


Thus, if tools are used together by the same voter it does not imply that they are used on the sameproject, but we can assume some affinity between those tools, since data scientists tend to use their favorite tool combinations on many projects.

First, we looked at associations between the top 10 tools.

There are many ways to measure how significant is associations between two nominal or binary features, like chi-square or T-test, but as we did in our 2015 analysis (Which Big Data, Data Mining, and Data Science Tools go together?), we used a simple measure we call "Lift", defined as

Lift (X & Y) = pct (X & Y) / ( pct (X) * pct (Y) )

where pct(X) is the percent of users who selected X.

Lift (X&Y) > 1 indicates that X&Y appear together more than expected if they were independent,
Lift=1 if X & Y appear with frequency expected if they are independent, and
Lift < 1 if X & Y appear together less than expected (negatively correlated)

Fig. 1 below shows the pairwise lift between the top 10 tools. The diagonal is left blank, since we don't need a lift between a tool and itself.

Note that the chart is symmetric relative to the diagonal, since the lift measure is symmetric:
Lift (X & Y) = Lift (Y & X).

However we show both upper and lower triangles of the chart to make it easier to see patterns across rows and columns.


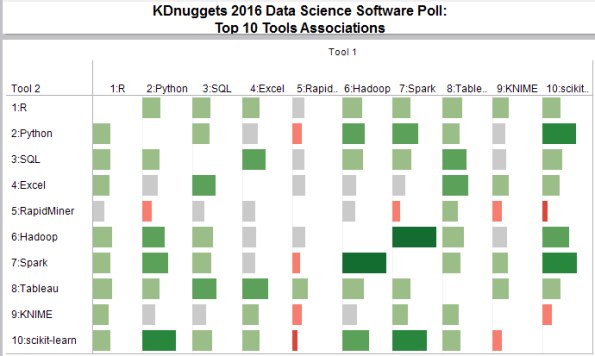
Fig. 1: KDnuggets Data Science Software Poll Top 10 tools, Pairwise lift

We note R and Python generally "play" well with other tools except RapidMiner, SQL and Excel go well with Tableau, RapidMiner is used less with other tools than average, while Hadoop and Spark used more with other tools. Not surprisingly, scikit-learn is used most with Python, but interestingly, also with Spark.

Spark and Hadoop have the highest lift=2.66, while RapidMiner and scikit-learn have the lowest lift=0.59.

Here is the same chart with lift values shown.


Fig. 1b: KDnuggets Data Science Software Poll Top 10 tools, Pairwise lift

Next we look at associations between top 5 commercial and top 5 free tools.

We note that R, Tableau and MATLAB "play" well with other tools, while RapidMiner users use less other tools than average.


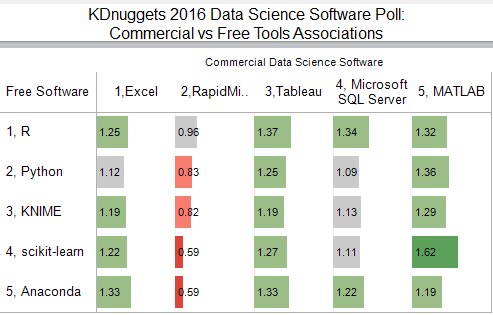
Fig. 2: KDnuggets Data Science Software Poll
Top 5 Commercial vs Top 5 Free Tools, pairwise lift


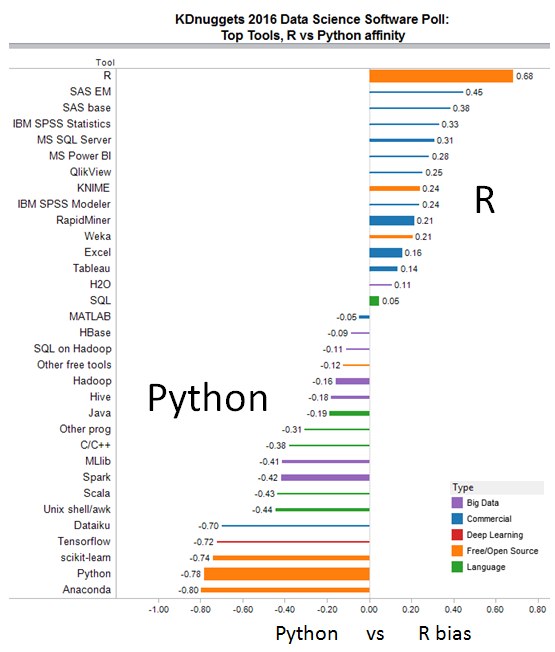
We can use a similar approach to measure the affinity of tools to R vs Python.
二维码

扫码加我 拉你入群

请注明:姓名-公司-职位

以便审核进群资格,未注明则拒绝

关键词:Data Science software Big data together Learning software together

本帖被以下文库推荐

缺少币币的网友请访问有奖回帖集合
https://bbs.pinggu.org/thread-3990750-1-1.html
沙发
oliyiyi 发表于 2016-7-6 07:10:38 |只看作者 |坛友微信交流群
For each tool, we compute the R% and Py% - % of time this tool is used along with R or Python. We define R/Python bias as the ratio of R%/Py% for this tool, divided by global ratio of R/Python = 1.071.

R_Py_bias(X) = R%(X)/Py%(X) / (R%(all)/Py%(all)) .

Fig 3 shows R/Python bias for top tools (with >150 votes). To make the patterns easier to see we chart log2(R_Py_bias).


Fig. 3: KDnuggets Data Science Software Poll
R/Python bias for top tools


We note that the tools with R bias are mainly blue (commercial), except for KNIME and Weka, while tools with Python bias are Free/Open Source (orange), Languages (green) and Big Data (purple).

Anaconda and scikit-learn, which are based on Python, have the largest Python bias, while SAS, SQL Server, IBM SPSS Statistics, KNIME, and RapidMiner have R bias.

Next we compute Big Data affinity for top tools (> 150 votes). We define it as the number of voters who used tool X and a Big Data tool, divided by number who used tool X. We exclude Big Data tools from this list since they all have affinity of 100%. Overall, 39% have used Big Data tools.


Fig. 4: KDnuggets Data Science Software Poll
Big Data affinity for top tools

Bar height corresponds to tool global share, bar length is the % of tool users that also use Big Data tools, and bar color is the tool type: Commercial, Deep Learning, Free/Open Source or Language.

We note that Scala has an amazing 95% correlation with Big Data. Most of the tools with high Big Data affinity are languages or free tools, It is expected that Tensorflow is used frequently Big Data (it has 77% affinity), but we also note that 23% of Tensorflow users are still in learning phase, and have not used any Big Data tools.

Next, we compute Deep Learning affinity among top tools using a similar approach.
缺少币币的网友请访问有奖回帖集合
https://bbs.pinggu.org/thread-3990750-1-1.html

使用道具

藤椅
oliyiyi 发表于 2016-7-6 07:11:15 |只看作者 |坛友微信交流群
By Gregory Piatetsky, KDnuggets.

Fig. 5: KDnuggets Data Science Software Poll
Deep Learning affinity for top tools


We note that Big Data tools have higher Deep Learning affinity (not surprising, since DL needs a lot of data). We also see languages: C/C++, Scala, Java, and Python with higher DL affinity.

The commercial tool with the highest DL affinity is MATLAB, thanks to its Deep Learning toolbox.

Next we combine Big Data and Deep Learning measures on the same chart.


Fig. 6: KDnuggets Data Science Software Poll
Big Data vs Deep Learning affinity for top tools


We note that there some overall pattern - higher Big Data affinity corresponds to higher Deep Learning affinity. Scala is a big outlier which ranks near the top on both charts, so if you want to be a Deep Big Data Scientist, learn Scala.

Next we compute the R and Python bias by region. Here R% (region) is % of users in that region that use R, and R_bias(region) = log2 (R% (region) / R% (all)), and likewise for Python.


Fig. 7: KDnuggets Data Science Software Poll
Regional bias for R & Python


We note that US/Canada are average, W. Europe has a Python bias, Asia has a strong R bias, E. Europe is much weaker on R, while Latin America is much stronger on R and weaker on Python.

Finally, here is the table with regional distribution. Here the R % is the percentage of users in that region which use R, and similarly for Python, Big Data, and Deep Learning.

RegionCountR %Python%Big Data %DL%
US/Canada116449.2%46.2%36.4%14.6%
W. Europe90347.7%48.0%40.3%18.4%
Asia27357.5%44.3%49.8%22.7%
E. Europe24040.4%45.0%39.6%18.3%
Latin America16953.8%37.3%32.5%21.9%
Africa/MidEast8343.4%34.9%44.6%26.5%
Australia/NZ6354.0%52.4%33.3%14.3%
All289549.0%45.8%39.1%17.6%


缺少币币的网友请访问有奖回帖集合
https://bbs.pinggu.org/thread-3990750-1-1.html

使用道具

板凳
mj2012 发表于 2016-7-6 07:28:00 来自手机 |只看作者 |坛友微信交流群
oliyiyi 发表于 2016-7-6 07:10
Last week, I reported the results of 2016 KDnuggets Software Poll: R, Python Duel As Top Analytics,  ...
作个记号

使用道具

您需要登录后才可以回帖 登录 | 我要注册

本版微信群
加好友,备注jltj
拉您入交流群

京ICP备16021002-2号 京B2-20170662号 京公网安备 11010802022788号 论坛法律顾问:王进律师 知识产权保护声明   免责及隐私声明

GMT+8, 2024-4-20 01:32