


 雷达卡
雷达卡


本帖隐藏的内容
Standard Deviation, a quick recap
Standard deviation is a metric of variance i.e. how much the individual data points are spread out from the mean.
From Wikipedia.
For example, consider the two data sets:
27 23 25 22 23 20 20 25 29 29
and
Both have the same mean 25. However, the first dataset has values closer to the mean and the second dataset has values more spread out.
To be more precise, the standard deviation for the first dataset is 3.13 and for the second set is 14.67.
However, it's not easy to wrap your head around numbers like 3.13 or 14.67. Right now, we only know that the second data set is more “spread out” than the first one.
Let’s put this to a more practical use.
What is normal distribution?
When we perform analytics, we often come across data that follow a pattern with values rallying around a mean and having almost equal results below and above it e.g.
- height of people,
- blood pressure values
- test marks
Such values follow a normal distribution.
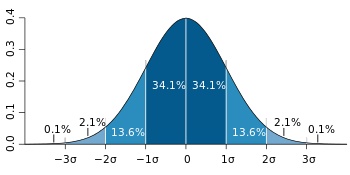
According to the Wikipedia article on normal distribution, about 68% of values drawn from a normal distribution are within one standard deviation σ away from the mean; about 95% of the values lie within two standard deviations; and about 99.7% are within three standard deviations.
This fact is known as the 68-95-99.7 (empirical) rule, or the 3-sigma rule.
Remove Outliers Using Normal Distribution and S.D.
I applied this rule successfully when I had to clean up data from millions of IoT devices generating heating equipment data. Each data point contained the electricity usage at a point of time.
However, sometimes the devices weren’t 100% accurate and would give very high or very low values.
We needed to remove these outlier values because they were making the scales on our graph unrealistic. The challenge was that the number of these outlier values was never fixed. Sometimes we would get all valid values and sometimes these erroneous readings would cover as much as 10% of the data points.
Our approach was to remove the outlier points by eliminating any points that were above (Mean + 2*SD) and any points below (Mean - 2*SD) before plotting the frequencies.
You don’t have to use 2 though, you can tweak it a little to get a better outlier detection formula for your data.
Here’s an example using Python programming. The dataset is a classic normal distribution but as you can see, there are some values like 10, 20 which will disturb our analysis and ruin the scales on our graphs.
| import numpy | |
| arr = [10, 386, 479, 627, 20, 523, 482, 483, 542, 699, 535, 617, 577, 471, 615, 583, 441, 562, 563, 527, 453, 530, 433, 541, 585, 704, 443, 569, 430, 637, 331, 511, 552, 496, 484, 566, 554, 472, 335, 440, 579, 341, 545, 615, 548, 604, 439, 556, 442, 461, 624, 611, 444, 578, 405, 487, 490, 496, 398, 512, 422, 455, 449, 432, 607, 679, 434, 597, 639, 565, 415, 486, 668, 414, 665, 763, 557, 304, 404, 454, 689, 610, 483, 441, 657, 590, 492, 476, 437, 483, 529, 363, 711, 543] | |
| elements = numpy.array(arr) | |
| mean = numpy.mean(elements, axis=0) | |
| sd = numpy.std(elements, axis=0) | |
| final_list = [x for x in arr if (x > mean - 2 * sd)] | |
| final_list = [x for x in final_list if (x < mean + 2 * sd)] | |
| print(final_list) |
view rawstandard-dev-.py hosted with ❤ by GitHub
As you case see, we removed the outlier values and if we plot this dataset, our plot will look much better.
[386, 479, 627, 523, 482, 483, 542, 699, 535, 617, 577, 471, 615, 583, 441, 562, 563, 527, 453, 530, 433, 541, 585, 704, 443, 569, 430, 637, 331, 511, 552, 496, 484, 566, 554, 472, 335, 440, 579, 341, 545, 615, 548, 604, 439, 556, 442, 461, 624, 611, 444, 578, 405, 487, 490, 496, 398, 512, 422, 455, 449, 432, 607, 679, 434, 597, 639, 565, 415, 486, 668, 414, 665, 557, 304, 404, 454, 689, 610, 483, 441, 657, 590, 492, 476, 437, 483, 529, 363, 711, 543]As you can see, we were able to remove outliers. I wouldn’t recommend this method for all statistical analysis though, outliers have an import function in statistics and they are there for a reason!
But in our case, the outliers were clearly because of error in the data and the data was in a normal distribution so standard deviation made sense.
Bio: Punit Jajodia is an entrepreneur and software developer from Kathmandu, Nepal. Versatility is his biggest strength, as he has worked on a variety of projects from real-time 3D simulations on the browser and big data analytics to Windows application development. He's also the co-founder of Programiz.com, one of the largest tutorial websites on Python and R.
 提升卡
提升卡 置顶卡
置顶卡 沉默卡
沉默卡 变色卡
变色卡 抢沙发
抢沙发 千斤顶
千斤顶 显身卡
显身卡


 京公网安备 11010802022788号


