请选择 进入手机版 | 继续访问电脑版
楼主: igs816
2541 30

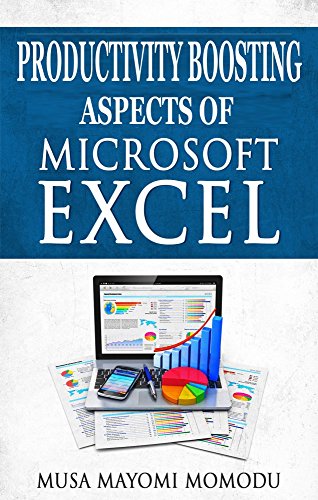
[书籍介绍] Productivity Boosting Aspects of Microsoft Excel [推广有奖]

泰斗

5%

还不是VIP/贵宾

-

威望
9
论坛币
2694388 个
通用积分
18515.3277
学术水平
2743 点
热心指数
3466 点
信用等级
2559 点
经验
484572 点
帖子
5413
精华
52
在线时间
3586 小时
注册时间
2007-8-6
最后登录
2024-4-18

高级学术勋章 特级学术勋章 高级信用勋章 特级信用勋章 高级热心勋章 特级热心勋章

igs816 在职认证  发表于 2017-6-2 21:39:59 |显示全部楼层 |坛友微信交流群
相似文件 换一批

+2 论坛币
k人 参与回答

经管之家送您一份

应届毕业生专属福利!

求职就业群
赵安豆老师微信:zhaoandou666

经管之家联合CDA

送您一个全额奖学金名额~ !

感谢您参与论坛问题回答

经管之家送您两个论坛币!

+2 论坛币
x558eB5KWTWRu6TqkiWMg0epevywOBtm.jpg

English | 2016 | ASIN: B01ELB97KM | 318 pages | PDF | 19MB
Making better-informed business decisions to increase productivity and profitability is arguably becoming most difficult task for every manager due to huge volume of data needed to deal with and understand. Knowing the effective and efficient approach of turning this huge raw data into relevant information to enhance business success in today's challenging and competitive-environment inform the written of this book to Instilling Data Intelligence using Microsoft Excel and examine productivities boosting aspects of Excel.The book focused more on how to improve your Microsoft Excel skills and furnished you with opportunities to be versed with functionality of jobs, functions and formulas that are needed to grow fast and stay competitive. Our illustrations mirror the likely situation you might experience at work. Microsoft Excel was chosen because it remains one of the most cost effective and popular spreadsheet today.
The essence of chapter one is to familiarise you with the Excel environment by simply introduce you to various features of Microsoft Excel while chapter two focused on the classification of data to various types based on predefined characteristics and how its value should be stored, what it takes for a datasheet to stands the test of time, what constitute data to be good, and business analysis aided tools.Data formatting (cleansing) is an essential process of transforming raw data into proper format (Good Data) using tools such as Tables, Flash fill, Text-to-Column, Validation, and Group to enhance all kind of operations in excel, simplify all stages of data analysis, and succinctly gives clear picture of the message been communicate was explained in chapter three. The amazing sort function use to change the order of data as chooses and filter function helps to focus on a specific set of extracted (filtered) data was discussed in chapter four. Knowing the right graphing tool for message is very important to produce effective reports that arereadable and summarily convey the right messages were explained in chapter five. Chapter six focused on conditional formatting to indicate various metrics performance in a report and how to prevent unnecessary alteration to reports generated.Techniques involve IF related functions to trick Microsoft Excel to generate significant business reports took centre stage in chapter seven while chapter eight explained those LOOKUP Excel Formulas that will enable you to carry out hundreds of searches, calculations and analysis in minutes. While chapter nine explained ideal Excel functions that will help you to maintaining highest level processing speed of lookup formulas in workbooks that contain thousands of lookup formulas as well overcome any form of value error that may arise while working with huge dataset.

Chapter ten is all about Array in Excel. Chapter eleven and twelve will inundate you with how productive and useful both Excel Mathematics and text functions could simplify dynamic reports generation. How to use excel built-in functions to determine the status of data and errors handling in excel were explained in chapter thirteen.

Sparklines took the centre stage in chapter fourteen, while chapter fifteen was setup to facilitate you with business analysis tools used to manage different business Scenarios and come out with the best results that will set you in right direction toward increasing productivity and profitability.Chapter sixteen and seventeen clearly explained essential Excel tools such as PivotTable, Pivot Charts, Slicers, and Timelines used to explore and analyze huge data set in order to generate an interactive and user friendly summary reports. Statistical tools such as correlation and regression used to determine the relationship between variables while carrying out data analysis were explained in chapter eighteen while Microsoft VBA popularly known as MACRO took the centre stage in chapter nineteen.

本帖隐藏的内容

Productivity Boosting Aspects of Microsoft Excel.pdf (19.44 MB, 需要: 10 个论坛币)


二维码

扫码加我 拉你入群

请注明:姓名-公司-职位

以便审核进群资格,未注明则拒绝

关键词:Productivity Microsoft Boosting Aspects Product Microsoft Excel

已有 1 人评分经验 论坛币 学术水平 热心指数 收起 理由
車樹森 + 10 + 10 + 1 + 3 精彩帖子

总评分: 经验 + 10  论坛币 + 10  学术水平 + 1  热心指数 + 3   查看全部评分

本帖被以下文库推荐

edmcheng 发表于 2017-6-2 22:06:32 |显示全部楼层 |坛友微信交流群
Thanks a lot

使用道具

fengyg 企业认证  发表于 2017-6-2 22:34:32 |显示全部楼层 |坛友微信交流群
kankan

使用道具

lichonggao 发表于 2017-6-2 22:44:27 |显示全部楼层 |坛友微信交流群

使用道具

smartlife 在职认证  发表于 2017-6-2 22:48:34 |显示全部楼层 |坛友微信交流群

使用道具

nicacc 在职认证  发表于 2017-6-2 23:18:23 |显示全部楼层 |坛友微信交流群
thank you

使用道具

nkunku 发表于 2017-6-3 05:45:22 |显示全部楼层 |坛友微信交流群
Productivity Boosting Aspects of Microsoft Excel

使用道具

MouJack007 发表于 2017-6-3 06:28:03 |显示全部楼层 |坛友微信交流群
谢谢楼主分享!

使用道具

MouJack007 发表于 2017-6-3 06:28:20 |显示全部楼层 |坛友微信交流群

使用道具

zhaosl 发表于 2017-6-3 06:38:31 |显示全部楼层 |坛友微信交流群

使用道具

您需要登录后才可以回帖 登录 | 我要注册

本版微信群
加好友,备注cda
拉您进交流群

京ICP备16021002-2号 京B2-20170662号 京公网安备 11010802022788号 论坛法律顾问:王进律师 知识产权保护声明   免责及隐私声明

GMT+8, 2024-4-19 09:41