请选择 进入手机版 | 继续访问电脑版
楼主: l1i2n3i4n5g
31559 123

[学习分享] 如何用SAS画统计图,这是我的学习分享!   [推广有奖]

l1i2n3i4n5g 在职认证  发表于 2018-2-6 09:38:59 |显示全部楼层 |坛友微信交流群

BUTTERFLY GROUP BAR CHART
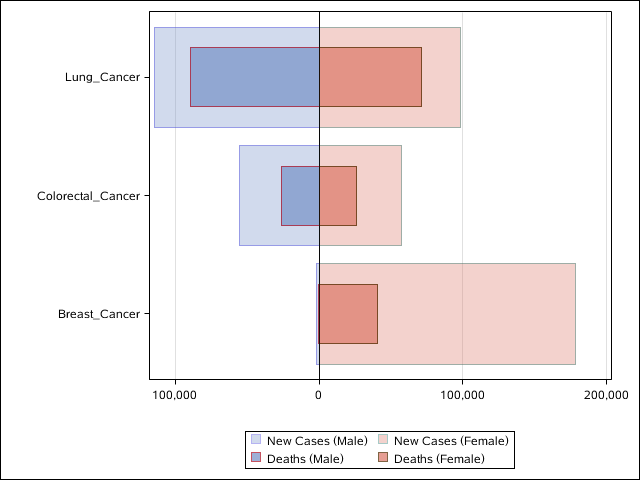
BUTTERFLY GROUP BAR CHART

  1. %macro comment();    /*这是一种比较特殊的注释方式*/
  2.    Picture: BUTTERFLY GROUP BAR CHART (Clinical Trial Reporting)
  3.    Software: SAS 9.4 TS Level 1M2
  4.    Name: justsoso
  5.    Date: 20180205
  6.    From: Clinical Trial Reporting Using SAS/GRAPH? SG Procedures
  7.          http://support.sas.com/resources/papers/proceedings09/174-2009.pdf
  8.    History: 20180205;
  9. %mend;

  10. /*建立数据集cancer,用于后续画图*/
  11. data cancer;
  12. /*label response = 'Mean Clinical Response'    label会体现在图的x、y轴label
  13.       visit    = 'Visit';*/
  14. input cause :$20.
  15.       mcases
  16.       fcases
  17.       mdeaths
  18.       fdeaths
  19.       deaths;
  20. cards;
  21. Lung_Cancer -114760 98620 -89510 70880 160390
  22. Colorectal_Cancer -55290 57050 -26000 26180 52180
  23. Breast_Cancer -2030 178480 -450 40460 40910
  24. ;
  25. run;

  26. proc format;
  27. picture positive low-<0='000,000'
  28. 0<-high='000,000';
  29. run;
  30. proc sort data=cancer;
  31. by descending deaths;
  32. run;

  33. ods _all_ close;     /*关闭所有ods destinations,避免不必要的输出,节省计算机资源*/
  34. ods listing gpath='C:\Users\Administrator\Desktop\test20180205';
  35. /*打开ods listing这一destination,指定图片保存路径,★★★★★需提前建立*/
  36. /*ods graphics on / imagename="picture" outputfmt=pdf;     图片名称picture,输出类型pdf*/
  37. ods graphics off;

  38. /*BUTTERFLY GROUP BAR CHART*/
  39. proc sgplot data=cancer;
  40.    format mcases mdeaths
  41.    fcases fdeaths positive.;
  42.    hbar cause / response=mcases
  43.    fillattrs=graphdata1 transparency=.65
  44.    legendlabel="New Cases (Male)"
  45.    name="mcases" ;
  46.    hbar cause / response=mdeaths
  47.    barwidth=.5
  48.    fillattrs=graphdata1 transparency=.25
  49.    legendlabel="Deaths (Male)"
  50.    name="mdeaths" ;
  51.    hbar cause / response=fcases
  52.    fillattrs=graphdata2 transparency=.65
  53.    legendlabel="New Cases (Female)"
  54.    name="fcases";
  55.    hbar cause / response=fdeaths
  56.    barwidth=.5
  57.    fillattrs=graphdata2 transparency=.25
  58.    legendlabel="Deaths (Female)"
  59.    name="fdeaths";
  60.    keylegend "mcases" "fcases" "mdeaths"
  61.    "fdeaths" / across=2;
  62.    xaxis label=" " grid;
  63.    yaxis label=" " discreteorder=data;
  64. run;

  65. ods _all_ close;
  66. /*ods html;      最好将ods destination恢复至默认的html*/
复制代码


使用道具

l1i2n3i4n5g 在职认证  发表于 2018-2-6 13:55:03 |显示全部楼层 |坛友微信交流群

Logarithmic Scale on the Y Axis

Logarithmic Scale on the Y Axis

  1. %macro comment();    /*这是一种比较特殊的注释方式*/
  2.    Picture: Logarithmic Scale on the Y Axis (Clinical Trial Reporting)
  3.    Software: SAS 9.4 TS Level 1M2
  4.    Name: justsoso
  5.    Date: 20180206
  6.    From: Clinical Trial Reporting Using SAS/GRAPH? SG Procedures
  7.          http://support.sas.com/resources/papers/proceedings09/174-2009.pdf
  8.    History: 20180206;
  9. %mend;

  10. /*建立数据集diabetes,用于后续画图*/
  11. data diabetes;
  12. /*label response = 'Mean Clinical Response'    label会体现在图的x、y轴label
  13.       visit    = 'Visit';*/
  14. input age Cpeptide;
  15. cards;
  16. 5.2 4.8
  17. 8.8 4.1
  18. 10.5 5.2
  19. 10.6 5.5
  20. 1 3
  21. 1.5 4
  22. 8 4.9
  23. 10 5.9
  24. 10.8 5.8
  25. 15 5.9
  26. 14.8 5.8
  27. 3 5.9
  28. 4 5.8
  29. 5 5.9
  30. 12.8 5.8
  31. ;
  32. run;

  33. ods _all_ close;     /*关闭所有ods destinations,避免不必要的输出,节省计算机资源*/
  34. ods listing gpath='C:\Users\Administrator\Desktop\test20180206';
  35. /*打开ods listing这一destination,指定图片保存路径,★★★★★需提前建立*/
  36. /*ods graphics on / imagename="picture" outputfmt=pdf;     图片名称picture,输出类型pdf*/
  37. ods graphics off;

  38. /*Logarithmic Scale on the Y Axis*/
  39. proc sgplot data=diabetes;
  40.    pbspline x=age y=Cpeptide /
  41.    clm="99% CLM" cli="99% CLI"
  42.    markerattrs=(symbol=squarefilled);
  43.    refline 4.4817 / label='1.5'
  44.    labelpos=min;
  45.    yaxis type=log logbase=e
  46.    logstyle=logexponent
  47.    label='log (base e) C-peptide';
  48. run;

  49. ods _all_ close;
  50. /*ods html;      最好将ods destination恢复至默认的html*/
复制代码


使用道具

l1i2n3i4n5g 在职认证  发表于 2018-2-6 14:17:32 |显示全部楼层 |坛友微信交流群

Customized GTL Code_before GTL

Customized GTL Code_before GTL

Customized GTL Code_after GTL

Customized GTL Code_after GTL

  1. %macro comment();    /*这是一种比较特殊的注释方式*/
  2.    Picture: Customized GTL Code (Clinical Trial Reporting)
  3.    Software: SAS 9.4 TS Level 1M2
  4.    Name: justsoso
  5.    Date: 20180206
  6.    From: Clinical Trial Reporting Using SAS/GRAPH? SG Procedures
  7.          http://support.sas.com/resources/papers/proceedings09/174-2009.pdf
  8.    History: 20180206;
  9. %mend;

  10. ods _all_ close;     /*关闭所有ods destinations,避免不必要的输出,节省计算机资源*/
  11. ods listing gpath='C:\Users\Administrator\Desktop\test20180206_1';
  12. /*打开ods listing这一destination,指定图片保存路径,★★★★★需提前建立*/
  13. /*ods graphics on / imagename="picture" outputfmt=pdf;     图片名称picture,输出类型pdf*/
  14. ods graphics off;

  15. /*Customized GTL Code*/
  16. proc sgplot data=sashelp.class;
  17.    scatter x=weight y=height;
  18.    refline 100 / axis=x labelloc=inside label='Weight=100 lb' ;
  19. run;

  20. proc template;
  21.    define statgraph mysgplot;
  22.    begingraph;
  23.       layout overlay;
  24.          ScatterPlot X=Weight Y=Height / primary=true LegendLabel="Height" name="scatter";
  25.          ReferenceLine x=100 / clip=true CurveLabel="Weight=100 lb"
  26.          CurveLabelLocation=Inside curvelabelattrs=(color=red style=italic size=12pt);
  27.       endlayout;
  28.    endgraph;
  29.    end;
  30. run;

  31. proc sgrender data=sashelp.class
  32.    template=mysgplot;
  33. run;

  34. ods _all_ close;
  35. /*ods html;      最好将ods destination恢复至默认的html*/
复制代码


使用道具

l1i2n3i4n5g 在职认证  发表于 2018-3-1 10:38:54 |显示全部楼层 |坛友微信交流群

20180229_Scatter Plot (using template and sgrender procedure)

20180229_Scatter Plot (using template and sgrender procedure)

  1. %macro comment();    /*这是一种比较特殊的注释方式*/
  2.    Picture: Scatter Plot (using template and sgrender procedure)
  3.    Software: SAS 9.4 TS Level 1M2
  4.    Name: justsoso
  5.    Date: 20180229
  6.    From: Getting Started with the Graph Template Language in SAS:
  7.          Examples, Tips, and Techniques for Creating Custom Graphs
  8.    History: 20180229;
  9. %mend;

  10. ods _all_ close;     /*关闭所有ods destinations,避免不必要的输出,节省计算机资源*/
  11. ods listing gpath='C:\Users\Administrator\Desktop\test20180229';
  12. /*打开ods listing这一destination,指定图片保存路径,★★★★★需提前建立*/
  13. /*ods graphics on / imagename="picture" outputfmt=pdf;     图片名称picture,输出类型pdf*/
  14. ods graphics off;

  15. /*Scatter Plot*/
  16. proc template; /*建立模板*/
  17. define statgraph Fig_4_2_1;   /*模板名为Fig_4_2_1*/
  18. begingraph;
  19. entrytitle 'Weight by Height';   /*指定title*/
  20. layout overlay / xaxisopts=(griddisplay=on) yaxisopts=(griddisplay=on); /*画网格*/
  21.    scatterplot x=height y=weight / group=sex datalabel=name name='a';/*画散点图*/
  22.    discretelegend 'a' / location=inside title='Sex:' halign=right valign=bottom ;/*图例*/
  23. endlayout;
  24. endgraph;
  25. end;
  26. run;
  27. proc sgrender data=sashelp.class template= Fig_4_2_1;
  28. run;

  29. ods _all_ close;
  30. /*ods html;      最好将ods destination恢复至默认的html*/
复制代码


使用道具

l1i2n3i4n5g 在职认证  发表于 2018-3-1 10:59:35 |显示全部楼层 |坛友微信交流群

Series Plot (using template and sgrender procedure)

Series Plot (using template and sgrender procedure)

  1. %macro comment();    /*这是一种比较特殊的注释方式*/
  2.    Picture: Series Plot (using template and sgrender procedure)
  3.    Software: SAS 9.4 TS Level 1M2
  4.    Name: justsoso
  5.    Date: 20180229
  6.    From: Getting Started with the Graph Template Language in SAS:
  7.          Examples, Tips, and Techniques for Creating Custom Graphs
  8.    History: 20180229;
  9. %mend;

  10. /*建立数据集diabetes,用于后续画图*/
  11. data GTL_GS_SeriesGroup;
  12. format Date Date9.;
  13. do i=0 to 334 by 30;
  14.    date='01jan2009'd+i;
  15.    if mod (i, 30) =0 then freq=1; else freq=0;
  16.    Drug='Drug A'; Val = 16+ 3*sin(i/90+0.5) + 1*sin(3*i/90+0.7); output;
  17.    Drug='Drug B'; Val = 10+ 3*sin(i/90+0.5) + 1*cos(3*i/90+0.7); output;
  18.    Drug='Drug C'; Val =  6+ 3*cos(i/90+0.5) + 1*sin(3*i/90+0.7); output;
  19. end;
  20. run;

  21. ods _all_ close;     /*关闭所有ods destinations,避免不必要的输出,节省计算机资源*/
  22. ods listing gpath='C:\Users\Administrator\Desktop\test20180229';
  23. /*打开ods listing这一destination,指定图片保存路径,★★★★★需提前建立*/
  24. /*ods graphics on / imagename="picture" outputfmt=pdf;     图片名称picture,输出类型pdf*/
  25. ods graphics off;

  26. /*Series Plot*/
  27. proc template;
  28. define statgraph Fig_4_2_2;
  29. dynamic _title;/*有用吗?*/
  30. begingraph / subpixel=on;/*配合smoothconnect=true,使图片更加光滑*/
  31. entrytitle 'Response by Time by Treatment';
  32. layout overlay / yaxisopts=(griddisplay=on label='Response')
  33.    xaxisopts=(griddisplay=on display=(ticks tickvalues));
  34.    seriesplot x=date y=val / group=drug curvelabel=drug display=(markers)/*marker为drug值*/
  35.       smoothconnect=true lineattrs=(thickness=2);/*smoothconnect类似样条曲线*/
  36. endlayout;
  37. endgraph;
  38. end;
  39. run;
  40. proc sgrender data=GTL_GS_SeriesGroup template=Fig_4_2_2;
  41. run;

  42. ods _all_ close;
  43. /*ods html;      最好将ods destination恢复至默认的html*/
复制代码


使用道具

l1i2n3i4n5g 在职认证  发表于 2018-3-1 11:19:39 |显示全部楼层 |坛友微信交流群

Step Plot (using template and sgrender procedure)

Step Plot (using template and sgrender procedure)

  1. %macro comment();    /*这是一种比较特殊的注释方式*/
  2.    Picture: Step Plot (using template and sgrender procedure)
  3.    Software: SAS 9.4 TS Level 1M2
  4.    Name: justsoso
  5.    Date: 20180229
  6.    From: Getting Started with the Graph Template Language in SAS:
  7.          Examples, Tips, and Techniques for Creating Custom Graphs
  8.    History: 20180229;
  9. %mend;

  10. /*建立数据集diabetes,用于后续画图*/
  11. data GTL_GS_stepGroup;
  12. format Date Date9.;
  13. do i=0 to 334 by 40;
  14.    date='01jan2009'd+i;
  15.    if mod (i, 30) =0 then freq=1; else freq=0;
  16.    Drug='Drug A'; Val = 16+ 3*sin(i/90+0.5) + 1*sin(3*i/90+0.7);
  17.    upper=val*1.1; lower=val*0.95; output;
  18.    Drug='Drug B'; Val = 11+ 3*sin(i/90+0.5) + 1*cos(3*i/90+0.7);
  19.    upper=val*1.1; lower=val*0.95; output;
  20.    if i > 150 and i < 210 then val=.;
  21.    else Val = 7+ 3*cos(i/90+0.5) + 1*sin(3*i/90+0.7);
  22.    Drug='Drug C'; upper=val*1.1; lower=val*0.95; output;
  23. end;
  24. run;

  25. ods _all_ close;     /*关闭所有ods destinations,避免不必要的输出,节省计算机资源*/
  26. ods listing gpath='C:\Users\Administrator\Desktop\test20180229';
  27. /*打开ods listing这一destination,指定图片保存路径,★★★★★需提前建立*/
  28. /*ods graphics on / imagename="picture" outputfmt=pdf;     图片名称picture,输出类型pdf*/
  29. ods graphics off;

  30. /*Step Plot*/
  31. proc template;
  32. define statgraph Fig_4_2_3;
  33. begingraph;
  34. entrytitle 'Response and CL by Time and Treatment';
  35. layout overlay / xaxisopts=(display=(ticks tickvalues line))
  36.    yaxisopts=(display=(ticks tickvalues line));
  37.    stepplot x=date y=val / group=drug name='s' errorupper=upper
  38.             errorlower=lower lineattrs=(pattern=solid) justify=center
  39.             display=(markers) markerattrs=(symbol=circlefilled) break=true
  40.             curvelabel=drug curvelabelposition=min;
  41. endlayout;
  42. endgraph;
  43. end;
  44. run;
  45. proc sgrender data=GTL_GS_stepGroup template=Fig_4_2_3;
  46. run;

  47. ods _all_ close;
  48. /*ods html;      最好将ods destination恢复至默认的html*/
复制代码


使用道具

l1i2n3i4n5g 在职认证  发表于 2018-3-1 11:30:56 |显示全部楼层 |坛友微信交流群

Band Plot (using template and sgrender procedure)

Band Plot (using template and sgrender procedure)

  1. %macro comment();    /*这是一种比较特殊的注释方式*/
  2.    Picture: Band Plot (using template and sgrender procedure)
  3.    Software: SAS 9.4 TS Level 1M2
  4.    Name: justsoso
  5.    Date: 20180229
  6.    From: Getting Started with the Graph Template Language in SAS:
  7.          Examples, Tips, and Techniques for Creating Custom Graphs
  8.    History: 20180229;
  9. %mend;

  10. /*建立数据集GTL_GS_bandGroup,用于后续画图*/
  11. data GTL_GS_bandGroup;
  12. format Date Date9.;
  13. do i=0 to 334 by 1;
  14.    date='01jan2009'd+i;
  15.    if mod (i, 30) =0 then freq=1; else freq=0;
  16.    Drug='Drug A'; Val = 16+ 3*sin(i/90+0.5) + 1*sin(3*i/90+0.7); upper=val*1.1; lower=val*0.95; output;
  17.    Drug='Drug B'; Val = 11+ 3*sin(i/90+0.5) + 1*cos(3*i/90+0.7); upper=val*1.1; lower=val*0.95; output;
  18.    Drug='Drug C'; Val = 12+ 3*cos(i/90+0.5) + 1*sin(3*i/90+0.7); upper=val*1.1; lower=val*0.95; output;
  19. end;
  20. run;

  21. ods _all_ close;     /*关闭所有ods destinations,避免不必要的输出,节省计算机资源*/
  22. ods listing gpath='C:\Users\Administrator\Desktop\test20180229';
  23. /*打开ods listing这一destination,指定图片保存路径,★★★★★需提前建立*/
  24. /*ods graphics on / imagename="picture" outputfmt=pdf;     图片名称picture,输出类型pdf*/
  25. ods graphics off;

  26. /*Band Plot*/
  27. proc template;
  28. define statgraph Fig_4_2_4;
  29. dynamic _title;
  30. begingraph / subpixel=on;
  31. entrytitle 'Response over Time';
  32. layout overlay / yaxisopts=(label='Response') xaxisopts=(display=(ticks tickvalues));
  33.    bandplot x=date limitupper=upper limitlower=lower /
  34.             group=drug display=(fill outline)
  35.             outlineattrs=(pattern=solid thickness=2)
  36.             fillattrs=(transparency=0.5) name='a';
  37.    discretelegend 'a' / location=inside halign=right valign=top across=1;
  38. endlayout;
  39. endgraph;
  40. end;
  41. run;
  42. proc sgrender data=GTL_GS_bandGroup template=Fig_4_2_4;
  43. run;

  44. ods _all_ close;
  45. /*ods html;      最好将ods destination恢复至默认的html*/
复制代码


使用道具

l1i2n3i4n5g 在职认证  发表于 2018-3-1 14:20:29 |显示全部楼层 |坛友微信交流群

High Low Plot (TYPE = Bar)

High Low Plot (TYPE = Bar)

  1. %macro comment();    /*这是一种比较特殊的注释方式*/
  2.    Picture: High Low Plot (TYPE = Bar) (using template and sgrender procedure)
  3.    Software: SAS 9.4 TS Level 1M2
  4.    Name: justsoso
  5.    Date: 20180229
  6.    From: Getting Started with the Graph Template Language in SAS:
  7.          Examples, Tips, and Techniques for Creating Custom Graphs
  8.    History: 20180229;
  9. %mend;

  10. /*建立数据集GTL_GS_highlow,用于后续画图*/
  11. data GTL_GS_highlow;
  12. length cap $ 12;
  13. input drug $ low high cap $;
  14. datalines;
  15. A      10 20 NONE
  16. A      30 60 NONE
  17. B      20 35 NONE
  18. B      50 75 NONE
  19. C      30 90 FILLEDARROW
  20. ;
  21. run;

  22. ods _all_ close;     /*关闭所有ods destinations,避免不必要的输出,节省计算机资源*/
  23. ods listing gpath='C:\Users\Administrator\Desktop\test20180229';
  24. /*打开ods listing这一destination,指定图片保存路径,★★★★★需提前建立*/
  25. /*ods graphics on / imagename="picture" outputfmt=pdf;     图片名称picture,输出类型pdf*/
  26. ods graphics off;

  27. /*High Low Plot (TYPE = Bar)*/
  28. proc template; /*--SAS 9.4--*/
  29. define statgraph Fig_4_2_6;
  30. begingraph;
  31. entrytitle 'Treatment by Days';
  32. layout overlay / xaxisopts=(griddisplay=on label='Days')
  33.    yaxisopts=(label='Treatment');
  34.    highlowplot y=drug high=high low=low / highcap=cap
  35.       highlabel=high type=bar group=drug dataskin=sheen
  36.       outlineattrs=(pattern =solid) barwidth=0.6
  37.       labelattrs=(size=10);
  38. endlayout;
  39. endgraph;
  40. end;
  41. run;
  42. proc sgrender data=GTL_GS_highlow template=Fig_4_2_6;
  43. run;

  44. ods _all_ close;
  45. /*ods html;      最好将ods destination恢复至默认的html*/
复制代码


使用道具

l1i2n3i4n5g 在职认证  发表于 2018-3-1 14:51:46 |显示全部楼层 |坛友微信交流群

Bubble Plot (using template and sgrender procedure)

Bubble Plot (using template and sgrender procedure)

  1. %macro comment();    /*这是一种比较特殊的注释方式*/
  2.    Picture: Bubble Plot (using template and sgrender procedure)
  3.    Software: SAS 9.4 TS Level 1M2
  4.    Name: justsoso
  5.    Date: 20180229
  6.    From: Getting Started with the Graph Template Language in SAS:
  7.          Examples, Tips, and Techniques for Creating Custom Graphs
  8.    History: 20180229;
  9. %mend;

  10. ods _all_ close;     /*关闭所有ods destinations,避免不必要的输出,节省计算机资源*/
  11. /*ods listing gpath='C:\Users\Administrator\Desktop\test20180229' image_dpi=100;*/
  12. ods listing gpath='C:\Users\Administrator\Desktop\test20180229';
  13. /*打开ods listing这一destination,指定图片保存路径,★★★★★需提前建立*/
  14. /*ods graphics on / imagename="picture" outputfmt=pdf width=4in height=2.5in;*/
  15. /*ods graphics on / imagename="picture" outputfmt=pdf;*/
  16. /*图片名称picture,输出类型pdf*/
  17. ods graphics off;

  18. /*Bubble Plot*/
  19. proc template; /*--SAS 9.4--*/
  20. define statgraph Fig_4_2_7;
  21. begingraph / subpixel=on;
  22. entrytitle 'Age by Height and Weight';
  23. layout overlay / xaxisopts=(griddisplay=on)
  24.    yaxisopts=(griddisplay=on);
  25.    bubbleplot x=height y=weight size=age / group=sex
  26.       dataskin=gloss name='a';
  27.    discretelegend 'a' / location=inside valign=bottom
  28.       halign=right title='Sex:';
  29. endlayout;
  30. endgraph;
  31. end;
  32. run;
  33. proc sgrender data=sashelp.class template=Fig_4_2_7;
  34. run;

  35. ods _all_ close;
  36. /*ods html;      最好将ods destination恢复至默认的html*/
复制代码


使用道具

l1i2n3i4n5g 在职认证  发表于 2018-3-1 15:18:05 |显示全部楼层 |坛友微信交流群

Needle Plot (using template and sgrender procedure)

Needle Plot (using template and sgrender procedure)

  1. %macro comment();    /*这是一种比较特殊的注释方式*/
  2.    Picture: Needle Plot (using template and sgrender procedure)
  3.    Software: SAS 9.4 TS Level 1M2
  4.    Name: justsoso
  5.    Date: 20180229
  6.    From: Getting Started with the Graph Template Language in SAS:
  7.          Examples, Tips, and Techniques for Creating Custom Graphs
  8.    History: 20180229;
  9. %mend;

  10. /*建立数据集GTL_GS_highlow,用于后续画图*/
  11. data GTL_GS_NeedleLabel;
  12. format Date Date9.;
  13. format a 4.3;
  14. do i=0 to 334 by 30;
  15.    date='01jan2009'd+i; A = 16+ 3*sin(i/90+0.5) + 1*sin(3*i/90+0.7); output;
  16. end;
  17. run;

  18. ods _all_ close;     /*关闭所有ods destinations,避免不必要的输出,节省计算机资源*/
  19. /*ods listing gpath='C:\Users\Administrator\Desktop\test20180229' image_dpi=100;*/
  20. ods listing gpath='C:\Users\Administrator\Desktop\test20180229';
  21. /*打开ods listing这一destination,指定图片保存路径,★★★★★需提前建立*/
  22. /*ods graphics on / imagename="picture" outputfmt=pdf width=4in height=2.5in;*/
  23. /*ods graphics on / imagename="picture" outputfmt=pdf;*/
  24. /*图片名称picture,输出类型pdf*/
  25. ods graphics off;

  26. /*Needle Plot*/
  27. proc template;
  28. define statgraph Fig_4_2_8;
  29. dynamic _title;
  30. begingraph;
  31. entrytitle 'Response over Time';
  32. layout overlay / xaxisopts=(display=(ticks tickvalues))
  33.    yaxisopts=(label='Response' offsetmin=0);
  34.    needleplot x=date y=a / display=(markers)
  35.       lineattrs=(thickness=3) datalabel=a
  36.       markerattrs=(symbol=circlefilled size=11)
  37.       datalabelposition=top datalabelattrs=(size=5);
  38. endlayout;
  39. endgraph;
  40. end;
  41. run;
  42. proc sgrender data=GTL_GS_NeedleLabel template=Fig_4_2_8;
  43. run;

  44. ods _all_ close;
  45. /*ods html;      最好将ods destination恢复至默认的html*/
复制代码


使用道具

您需要登录后才可以回帖 登录 | 我要注册

本版微信群
加好友,备注cda
拉您进交流群

京ICP备16021002-2号 京B2-20170662号 京公网安备 11010802022788号 论坛法律顾问:王进律师 知识产权保护声明   免责及隐私声明

GMT+8, 2024-4-16 15:11