请选择 进入手机版 | 继续访问电脑版
楼主: NewOccidental
8513 109

[读者文库]Mastering Scientific Computing with R   [推广有奖]

  • 0关注
  • 6粉丝

副教授

31%

还不是VIP/贵宾

-

TA的文库  其他...

Complex Data Analysis

东西方金融数据分析

eBook with Data and Code

威望
0
论坛币
11534 个
通用积分
1.4350
学术水平
119 点
热心指数
115 点
信用等级
114 点
经验
8940 点
帖子
173
精华
10
在线时间
30 小时
注册时间
2006-9-19
最后登录
2022-11-3

相似文件 换一批

+2 论坛币
k人 参与回答

经管之家送您一份

应届毕业生专属福利!

求职就业群
赵安豆老师微信:zhaoandou666

经管之家联合CDA

送您一个全额奖学金名额~ !

感谢您参与论坛问题回答

经管之家送您两个论坛币!

+2 论坛币

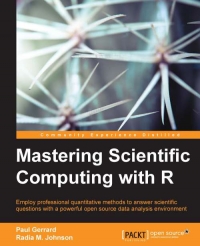
Mastering Scientific Computing with R

Employ professional quantitative methods to answer scientific questions with a powerful open source data analysis environment


Book Description
With this book, you will learn not just about R, but how to use R to answer conceptual, scientific, and experimental questions.

Beginning with an overview of fundamental R concepts, you'll learn how R can be used to achieve the most commonly needed scientific data analysis tasks: testing for statistically significant differences between groups and model relationships in data. You will delve into linear algebra and matrix operations with an emphasis not on the R syntax, but on how these operations can be used to address common computational or analytical needs. This book also covers the application of matrix operations for the purpose of finding structure in high-dimensional data using the principal component, exploratory factor, and confirmatory factor analysis in addition to structural equation modeling. You will also master methods for simulation and learn about an advanced analytical method.

Book Details
Publisher:        Packt Publishing
By:        Paul Gerrard, Radia M. Johnson
ISBN:        978-1-78355-525-3
Year:        2015
Pages:        432
Language:        English
File size:        5.3 MB
File format:        PDF
Download:   

本帖隐藏的内容

Mastering Scientific Computing with R.rar (3.64 MB, 需要: 20 个论坛币) 本附件包括:
  • Mastering Scientific Computing with R.pdf


二维码

扫码加我 拉你入群

请注明:姓名-公司-职位

以便审核进群资格,未注明则拒绝

关键词:Scientific Mastering computing Comput Master conceptual scientific overview concepts testing

已有 3 人评分经验 学术水平 热心指数 信用等级 收起 理由
oliyiyi + 100 精彩帖子
fantuanxiaot + 50 + 2 + 2 + 2 精彩帖子
xujingtang + 40 + 1 奖励积极上传好的资料

总评分: 经验 + 190  学术水平 + 2  热心指数 + 3  信用等级 + 2   查看全部评分

本帖被以下文库推荐

auirzxp 学生认证  发表于 2015-5-7 09:57:18 |显示全部楼层 |坛友微信交流群

Proportion Test using R

  1. Proportion tests

  2. Sometimes we want to evaluate proportions instead of individual measurements. Several statistical tests are used to determine whether the proportion observed in your dataset is significantly different from some theoretical value. Two useful statistical tests used in hypothesis testing for proportions are the traditional Z-test and the binomial exact test. Say we wanted to test that 50 percent of patients have to wait more than 4 hours to see a doctor. We can record the waiting period for 11 patients and store that information in a numerical vector as follows:

  3. > waiting.period <- c(3, 5, 4, 5.5, 3.5, 2.5, 3, 5, 4.5, 3, 3.5)
  4. Next, we can count the number of patients who waited for more than 4 hours by creating a table using the following commands:

  5. > above4.hrs <- ifelse(waiting.period > 4, "yes", "no")
  6. > above4hs.table <- table(above4.hrs)
  7. > above4hs.table
  8. above4.hrs
  9. no yes
  10.   7   4
  11. Now, if we can assume the waiting period to see a doctor is indeed 50 percent, then we can use a Z-test to this hypothesis using the prop.test() function:

  12. > prop.test(4, n=11, p=0.5, alternative="two.sided", correct=FALSE)
  13.   1-sample proportions test without continuity correction
  14. data:  4 out of 11, null probability 0.5
  15. X-squared = 0.8182, df = 1, p-value = 0.3657
  16. alternative hypothesis: true p is not equal to 0.5
  17. 95 percent confidence interval:
  18. 0.1516647 0.6461988
  19. sample estimates:
  20.         p
  21. 0.3636364
复制代码

使用道具

fjrong 在职认证  发表于 2015-5-7 10:07:45 |显示全部楼层 |坛友微信交流群

使用道具

slpg 发表于 2015-5-7 10:54:44 |显示全部楼层 |坛友微信交流群
  1. Two sample hypothesis tests

  2. So far, we have covered how to use statistical tests for hypothesis testing on a single sample distribution. However, these statistical tests can also be applied to compare two sample distributions. For example, we could test whether the mean of the probeA sample distribution was significantly different from the probeB sample distribution. If we can assume that the error of both samples are normally distributed, then we can use a t-test to compare the mean of both samples by entering t.test(probeA, probeB), as follows:

  3. > t.test(probeA, probeB)
  4.   Welch Two Sample t-test
  5. data:  probeA and probeB
  6. t = -35.8398, df = 58.92, p-value < 2.2e-16
  7. alternative hypothesis: true difference in means is not equal to 0
  8. 95 percent confidence interval:
  9. -3.486162 -3.117460
  10. sample estimates:
  11. mean of x mean of y
  12. 4.773866  8.075677
  13. If the errors are not normally distributed for these samples, we can run the Wilcoxon rank-sum test, as follows:

  14. > wilcox.test(probeA, probeB)
  15.   Wilcoxon rank sum test
  16. data:  probeA and probeB
  17. W = 0, p-value < 2.2e-16
  18. alternative hypothesis: true location shift is not equal to 0
复制代码

使用道具

sqy 发表于 2015-5-7 11:02:31 |显示全部楼层 |坛友微信交流群
ding!!!!!!!!!!!

使用道具

woodhaven 发表于 2015-5-7 11:07:37 |显示全部楼层 |坛友微信交流群
Thanks!

使用道具

lg21c 发表于 2015-5-7 11:17:54 |显示全部楼层 |坛友微信交流群
谢谢 谢谢谢谢谢谢谢谢谢谢谢谢谢谢

使用道具

vegebeef 发表于 2015-5-7 11:44:53 |显示全部楼层 |坛友微信交流群
支持!

使用道具

Edwardu 发表于 2015-5-7 11:51:36 |显示全部楼层 |坛友微信交流群
good book

使用道具

不错的书

使用道具

您需要登录后才可以回帖 登录 | 我要注册

本版微信群
加好友,备注jltj
拉您入交流群

京ICP备16021002-2号 京B2-20170662号 京公网安备 11010802022788号 论坛法律顾问:王进律师 知识产权保护声明   免责及隐私声明

GMT+8, 2024-3-28 22:01