A no-nonsense, 30,000 foot overview of Support Vector Machines, concisely explained with some great diagrams.
By Noel Bambrick, AYLIEN.
Introduction
In this post, we are going to introduce you to the Support Vector Machine (SVM) machine learning algorithm. We will follow a similar process to our recent post Naive Bayes for Dummies; A Simple Explanation by keeping it short and not overly-technical. The aim is to give those of you who are new to machine learning a basic understanding of the key concepts of this algorithm.
A Support Vector Machine (SVM) is a supervised machine learning algorithm that can be employed for both classification and regression purposes. SVMs are more commonly used in classification problems and as such, this is what we will focus on in this post.
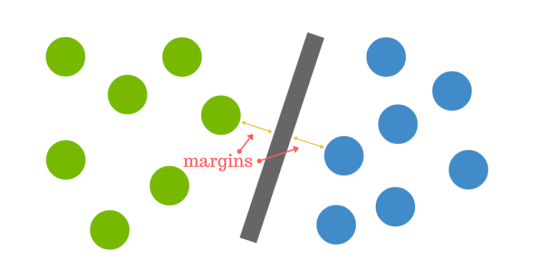
SVMs are based on the idea of finding a hyperplane that best divides a dataset into two classes, as shown in the image below.

Support vectors are the data points nearest to the hyperplane, the points of a data set that, if removed, would alter the position of the dividing hyperplane. Because of this, they can be considered the critical elements of a data set.
As a simple example, for a classification task with only two features (like the image above), you can think of a hyperplane as a line that linearly separates and classifies a set of data.
Intuitively, the further from the hyperplane our data points lie, the more confident we are that they have been correctly classified. We therefore want our data points to be as far away from the hyperplane as possible, while still being on the correct side of it.
So when new testing data is added, whatever side of the hyperplane it lands will decide the class that we assign to it.
How do we find the right hyperplane?
Or, in other words, how do we best segregate the two classes within the data?
The distance between the hyperplane and the nearest data point from either set is known as the margin. The goal is to choose a hyperplane with the greatest possible margin between the hyperplane and any point within the training set, giving a greater chance of new data being classified correctly.

This is where it can get tricky. Data is rarely ever as clean as our simple example above. A dataset will often look more like the jumbled balls below which represent a linearly non separable dataset.
 < In order to classify a dataset like the one above it’s necessary to move away from a 2d view of the data to a 3d view. Explaining this is easiest with another simplified example. Imagine that our two sets of colored balls above are sitting on a sheet and this sheet is lifted suddenly, launching the balls into the air. While the balls are up in the air, you use the sheet to separate them. This ‘lifting’ of the balls represents the mapping of data into a higher dimension. This is known as kernelling. You can read more on Kerneling here.

Because we are now in three dimensions, our hyperplane can no longer be a line. It must now be a plane as shown in the example above. The idea is that the data will continue to be mapped into higher and higher dimensions until a hyperplane can be formed to segregate it.
Pros & Cons of Support Vector Machines
Pros
- Accuracy
- Works well on smaller cleaner datasets
- It can be more efficient because it uses a subset of training points
Cons
- Isn’t suited to larger datasets as the training time with SVMs can be high
- Less effective on noisier datasets with overlapping classes
SVM is used for text classification tasks such as category assignment, detecting spam and sentiment analysis. It is also commonly used for image recognition challenges, performing particularly well in aspect-based recognition and color-based classification. SVM also plays a vital role in many areas of handwritten digit recognition, such as postal automation services.
There you have it, a very high level introduction to Support Vector Machines. If you’d like to dive deeper into SVM we recommend checking out (need to find a link to a video or a more in depth blog).
About: This blog was originally published on the AYLIEN Text Analysis blog. AYLIEN provides tools and services to help developers and data scientists make sense of unstructured content at scale.


 雷达卡
雷达卡


 京公网安备 11010802022788号


