楼主: l58po
2491 10

[书籍介绍] Interactive Web-Based Data Visualization with R [推广有奖]

  • 2关注
  • 7粉丝

教授

17%

还不是VIP/贵宾

-

威望
0
论坛币
22979 个
通用积分
195.8507
学术水平
44 点
热心指数
66 点
信用等级
43 点
经验
148755 点
帖子
559
精华
0
在线时间
1656 小时
注册时间
2009-6-24
最后登录
2023-5-7

相似文件 换一批

+2 论坛币
k人 参与回答

经管之家送您一份

应届毕业生专属福利!

求职就业群
赵安豆老师微信:zhaoandou666

经管之家联合CDA

送您一个全额奖学金名额~ !

感谢您参与论坛问题回答

经管之家送您两个论坛币!

+2 论坛币
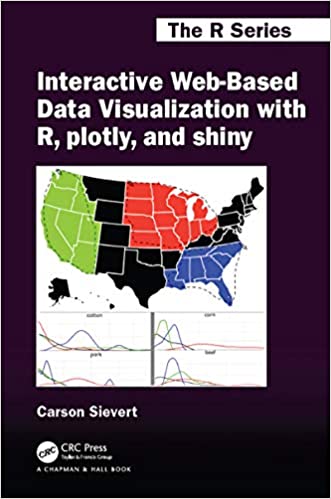
Interactive Web-Based Data Visualization with R, plotly, and shiny (Chapman & Hall/CRC The R Series)


The richly illustrated Interactive Web-Based Data Visualization with R, plotly, and shiny focuses on the process of programming interactive web graphics for multidimensional data analysis. It is written for the data analyst who wants to leverage the capabilities of interactive web graphics without having to learn web programming. Through many R code examples, you will learn how to tap the extensive functionality of these tools to enhance the presentation and exploration of data. By mastering these concepts and tools, you will impress your colleagues with your ability to quickly generate more informative, engaging, and reproducible interactive graphics using free and open source software that you can share over email, export to pdf, and more.

Key Features:


  • Convert static ggplot2 graphics to an interactive web-based form
  • Link, animate, and arrange multiple plots in standalone HTML from R
  • Embed, modify, and respond to plotly graphics in a shiny app
  • Learn best practices for visualizing continuous, discrete, and multivariate data
  • Learn numerous ways to visualize geo-spatial data

This book makes heavy use of plotly for graphical rendering, but you will also learn about other R packages that support different phases of a data science workflow, such as tidyr, dplyr, and tidyverse. Along the way, you will gain insight into best practices for visualization of high-dimensional data, statistical graphics, and graphical perception. The printed book is complemented by an interactive website where readers can view movies demonstrating the examples and interact with graphics.

  • Publisher : Chapman and Hall/CRC; 1st edition (January 21, 2020)
  • Language : English
  • Paperback : 470 pages


二维码

扫码加我 拉你入群

请注明:姓名-公司-职位

以便审核进群资格,未注明则拒绝

关键词:Interactive interact Visual Active ATION

如果链接失效请留言我会补充链接 R语言的数据可视化

71 Bytes

需要: 1 个论坛币  [购买]

一定要读好书

回帖推荐

lily0009 发表于4楼  查看完整内容

感谢分享
已有 1 人评分论坛币 收起 理由
cheetahfly + 30 精彩帖子

总评分: 论坛币 + 30   查看全部评分

沙发
yangming98 发表于 2021-2-24 21:15:33 来自手机 |只看作者 |坛友微信交流群
l58po 发表于 2021-2-24 14:54
Interactive Web-Based Data Visualization with R, plotly, and shiny (Chapman & Hall/CRC The R Series) ...
好的好的好的好的

使用道具

藤椅
l58po 发表于 2021-2-25 12:39:52 |只看作者 |坛友微信交流群
yangming98 发表于 2021-2-24 21:15
好的好的好的好的
!为你的回复点赞!

使用道具

板凳
lily0009 发表于 2021-2-25 14:25:09 |只看作者 |坛友微信交流群
感谢分享

使用道具

报纸
l58po 发表于 2021-2-25 17:56:44 |只看作者 |坛友微信交流群
lily0009 发表于 2021-2-25 14:25
感谢分享
不客气 R语言还是数据科学方面的主导语言之一

使用道具

地板
xfdexf 发表于 2021-2-28 22:26:39 |只看作者 |坛友微信交流群
楼主链接好像失效了啊,麻烦再发一遍吧

使用道具

7
showhsu 发表于 2022-5-20 10:22:40 |只看作者 |坛友微信交流群
無法連結,麻煩再給我一次連結,謝謝。

使用道具

8
jhmath 在职认证  发表于 2022-11-25 21:28:40 来自手机 |只看作者 |坛友微信交流群
l58po 发表于 2021-2-24 14:54
Interactive Web-Based Data Visualization with R, plotly, and shiny (Chapman & Hall/CRC The R Series) ...
买了,链接可是无效了!

使用道具

9
liuqiang0704 发表于 2022-11-25 22:31:05 |只看作者 |坛友微信交流群
失效了,更换一下把

使用道具

10
桃李年华 发表于 2023-7-23 17:12:03 |只看作者 |坛友微信交流群
失效了

使用道具

您需要登录后才可以回帖 登录 | 我要注册

本版微信群
加好友,备注cda
拉您进交流群

京ICP备16021002-2号 京B2-20170662号 京公网安备 11010802022788号 论坛法律顾问:王进律师 知识产权保护声明   免责及隐私声明

GMT+8, 2024-4-25 06:04