François Petitjean, Monash University.
In the 1920s, Muriel Bristol claimed to be able to tell whether the tea or the milk was added first to a cup. Ronald Fisher (yes, the Fisher) designed a controlled experiment to confirm or reject this hypothesis; this famous experiment was the start of statistical hypothesis testing: 1. formulate a hypothesis, 2. gather some data, 3. decide if your data confirms your hypothesis or not.
Since then, hypothesis testing has come a long way, with for instance Google or Microsoft now including your visit in hundreds of hypothesis tests each time you visit their search engines (see this great talk by Ron Kohavi).
The general aim is the same: make as many true discoveries as possible, while minimizing the risk of false discoveries (eg claiming that a drug works while it doesn't). Until recently, we only knew how to control this risk if we knew in advance how many things we would test.
 That's all changed with our latest paper at KDD'16; we show how to strictly control the risk of making a mistake over a series of tests, allowing you to draw conclusions as you go while knowing nothing about the tests that will be performed later. (We also attempted a video version if you prefer your science in the style of film noir parody.)
Imagine you want to know if a coin is biased. You toss it 100 times, and observe 39 heads and 61 tails. Then you run a statistical test which tells you that the probability of seeing something as biased as this, if the coin was fair, is less than 4%. Say you'd decided that 5% was your cut-off (I pass on the discussion about the relevance of p-values), you'd conclude that your coin was not fair. Now imagine that you repeat this experiment with 1,000 different unbiased coins. On average, you would decide that 50 coins are biased while they are actually fair.
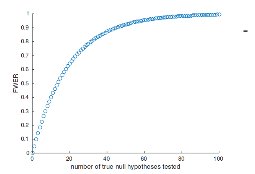
 This is called the multiple testing problem. I've plotted on the right what is called the 'Family-Wise Error Rate' (FWER - the probability of making at least one mistake), as a function of the number of tests you make. You can see that if you don't correct for this, then you will almost for sure make at least one mistake where you make 100 tests or more.
There are several processes that can minimize the risk of making these errors, the most famous of which is probably the Bonferroni correction. It says that basically, if you are going to do 1000 tests and you want to keep your risk below 5% (your cut-off value), then you should set your cut-off for each test at 0.05/1000. Simple.
How to correct for hypotheses cascades?
But what if you don't know in advance how many tests you will do? What if you want to test a bunch of hypotheses, accept some good ones, and then proceed to do some more tests based on those results? This is what we call a 'hypotheses cascade'. Until now, they were no methods that could help you avoid multiple testing errors in such a situation.
In the paper, we solve this problem through the use of a 'risk budget'. The idea is that you start with a budget of 5% and you spend some of this for each new bunch of hypotheses that you're testing. And this is where our core result is: we show how to calculate exactly what each bunch 'cost' you from your budget. This is what we express below: each bunch costs you the worst value that you have accepted () times the number of hypotheses in your bunch ().

Discovering the structure of the S&P500
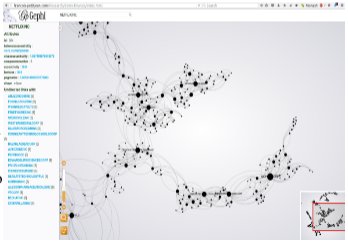
 In the paper, we apply our correction to model selection for the companies in the S&P500. We collected each company's daily share price since 1998. We then classified each stock as beating the market, underperforming, or moving with the market, independently for each day of trading. We then start with an empty graph with each node representing a company and examined the correlations found using our Chordalysis software. This is a typical case of hypotheses cascade because, at each step, we have a bunch of hypotheses associated with the addition of every edge, we then keep the best and loop. We do not know when we will stop and want to keep our risk of finding an incorrect edge under 5%. I've put the graph online so you can have a look at it (here); it seems that companies tend to group into different industry sectors, but there are also some less obvious patterns appearing...
Let me know if you find the portfolio allocation with it ;-)
Bio: François Petitjean is a Researcher in Machine Learning at the Monash University’s Centre for Data Science. He is interested in many things including time series analysis, graphical models and remote sensing. He tweets @LeDataMiner; let me know your thoughts.


 雷达卡
雷达卡


 京公网安备 11010802022788号


