


 雷达卡
雷达卡


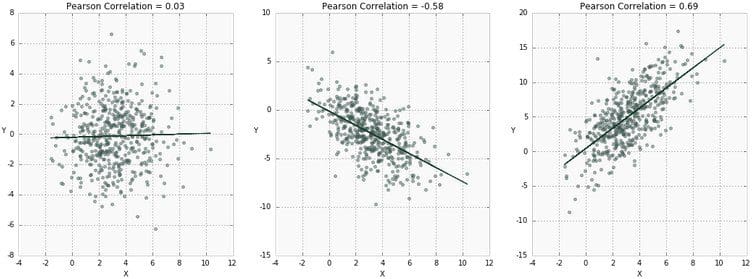
By DataScience.comSponsored Post. Correlation is one of the most widely used — and widely misunderstood — statistical concepts. In this overview, we provide the definitions and intuition behind several types of correlation and illustrate how to calculate correlation using the Python pandas library. The term "correlation" refers to a mutual relationship or association between quantities. In almost any business, it is useful to express one quantity in terms of its relationship with others. For example, sales might increase when the marketing department spends more on TV advertisements, or a customer's average purchase amount on an e-commerce website might depend on a number of factors related to that customer. Often, correlation is the first step to understanding these relationships and subsequently building better business and statistical models. So, why is correlation a useful metric? More formally, correlation is a statistical measure that describes the association between random variables. There are several methods for calculating the correlation coefficient, each measuring different types of strength of association. Below we summarize three of the most widely used methods. Before we go into the details of how correlation is calculated, it is important to introduce the concept of covariance. Covariance is a statistical measure of association between two variables X and Y. First, each variable is centered by subtracting its mean. These centered scores are multiplied together to measure whether the increase in one variable associates with the increase in another. Finally, expected value (E) of the product of these centered scores is calculated as a summary of association. Intuitively, the product of centered scores can be thought of as the area of a rectangle with each point's distance from the mean describing a side of the rectangle: If both variables tend to move in the same direction, we expect the "average" rectangle connecting each point (X_i, Y_i) to the means (X_bar, Y_bar) to have a large and positive diagonal vector, corresponding to a larger positive product in the equation above. If both variables tend to move in opposite directions, we expect the average rectangle to have a diagonal vector that is large and negative, corresponding to a larger negative product in the equation above. If the variables are unrelated, then the vectors should, on average, cancel out — and the total diagonal vector should have a magnitude near 0, corresponding to a product near 0 in the equation above. If you are wondering what "expected value" is, it is another way of saying the average, or mean μ, of a random variable. It is also referred to as "expectation." In other words, we can write the following equation to express the same quantity in a different way: The problem with covariance is that it keeps the scale of the variables X and Y, and therefore can take on any value. This makes interpretation difficult and comparing covariances to each other impossible. For example, Cov(X, Y) = 5.2 and Cov(Z, Q) = 3.1 tell us that these pairs are positively associated, but it is difficult to tell whether the relationship between X and Y is stronger than Z and Q without looking at the means and distributions of these variables. This is where correlation becomes useful — by standardizing covariance by some measure of variability in the data, it produces a quantity that has intuitive interpretations and consistent scale. Pearson is the most widely used correlation coefficient. Pearson correlation measures the linear association between continuous variables. In other words, this coefficient quantifies the degree to which a relationship between two variables can be described by a line. Remarkably, while correlation can have many interpretations, the same formula developed by Karl Pearson over 120 years ago is still the most widely used today. In this section, we will introduce several popular formulations and intuitive interpretations for Pearson correlation (referred to as ρ). The original formula for correlation, developed by Pearson himself, uses raw data and the means of two variables, X and Y: In this formulation, raw observations are centered by subtracting their means and re-scaled by a measure of standard deviations. A different way to express the same quantity is in terms of expected values, means μX, μY, and standard deviations σX, σY: Notice that the numerator of this fraction is identical to the above definition of covariance, since mean and expectation can be used interchangeably. Dividing the covariance between two variables by the product of standard deviations ensures that correlation will always fall between -1 and 1. This makes interpreting the correlation coefficient much easier. The figure below shows three examples of Pearson correlation. The closer ρ is to 1, the more an increase in one variable associates with an increase in the other. On the other hand, the closer ρ is to -1, the increase in one variable would result in decrease in the other. Note that if X and Y are independent, then ρ is close to 0, but not vice versa! In other words, Pearson correlation can be small even if there is a strong relationship between two variables. We will see shortly how this can be the case. So, how can we interpret Pearson correlation? Read the rest on DataScience.com : Introduction to Correlation本帖隐藏的内容


 京公网安备 11010802022788号


