楼主: oliyiyi
1772 4

Essentials of Machine Learning Algorithms (with Python and R Codes) [推广有奖]

版主

泰斗

0%

还不是VIP/贵宾

-

TA的文库  其他...

计量文库

威望
7
论坛币
271951 个
通用积分
31269.3519
学术水平
1435 点
热心指数
1554 点
信用等级
1345 点
经验
383775 点
帖子
9598
精华
66
在线时间
5468 小时
注册时间
2007-5-21
最后登录
2024-4-18

初级学术勋章 初级热心勋章 初级信用勋章 中级信用勋章 中级学术勋章 中级热心勋章 高级热心勋章 高级学术勋章 高级信用勋章 特级热心勋章 特级学术勋章 特级信用勋章

+2 论坛币
k人 参与回答

经管之家送您一份

应届毕业生专属福利!

求职就业群
赵安豆老师微信:zhaoandou666

经管之家联合CDA

送您一个全额奖学金名额~ !

感谢您参与论坛问题回答

经管之家送您两个论坛币!

+2 论坛币

Note: This article was originally published on Aug 10, 2015 and updated on Sept 9th, 2017

Introduction

Google’s self-driving cars and robots get a lot of press, but the company’s real future is in machine learning, the technology that enables computers to get smarter and more personal.

– Eric Schmidt (Google Chairman)

We are probably living in the most defining period of human history. The period when computing moved from large mainframes to PCs to cloud. But what makes it defining is not what has happened, but what is coming our way in years to come.

What makes this period exciting for some one like me is the democratization of the tools and techniques, which followed the boost in computing. Today, as a data scientist, I can build data crunching machines with complex algorithms for a few dollors per hour. But, reaching here wasn’t easy! I had my dark days and nights.

Who can benefit the most from this guide?What I am giving out today is probably the most valuable guide, I have ever created.

The idea behind creating this guide is to simplify the journey of aspiring data scientists and machine learning enthusiasts across the world. Through this guide, I will enable you to work on machine learning problems and gain from experience. I am providing a high level understanding about various machine learning algorithms along with R & Python codes to run them. These should be sufficient to get your hands dirty.

I have deliberately skipped the statistics behind these techniques, as you don’t need to understand them at the start. So, if you are looking for statistical understanding of these algorithms, you should look elsewhere. But, if you are looking to equip yourself to start building machine learning project, you are in for a treat.


Broadly, there are 3 types of Machine Learning Algorithms..1. Supervised Learning

How it works: This algorithm consist of a target / outcome variable (or dependent variable) which is to be predicted from a given set of predictors (independent variables). Using these set of variables, we generate a function that map inputs to desired outputs. The training process continues until the model achieves a desired level of accuracy on the training data. Examples of Supervised Learning: Regression, Decision Tree, Random Forest, KNN, Logistic Regression etc.


2. Unsupervised Learning

How it works: In this algorithm, we do not have any target or outcome variable to predict / estimate.  It is used for clustering population in different groups, which is widely used for segmenting customers in different groups for specific intervention. Examples of Unsupervised Learning: Apriori algorithm, K-means.


3. Reinforcement Learning:

How it works:  Using this algorithm, the machine is trained to make specific decisions. It works this way: the machine is exposed to an environment where it trains itself continually using trial and error. This machine learns from past experience and tries to capture the best possible knowledge to make accurate business decisions. Example of Reinforcement Learning: Markov Decision Process


二维码

扫码加我 拉你入群

请注明:姓名-公司-职位

以便审核进群资格,未注明则拒绝

关键词:Essentials Algorithms Essential Algorithm Learning

缺少币币的网友请访问有奖回帖集合
https://bbs.pinggu.org/thread-3990750-1-1.html
沙发
oliyiyi 发表于 2018-1-28 08:48:00 |只看作者 |坛友微信交流群
List of Common Machine Learning Algorithms

Here is the list of commonly used machine learning algorithms. These algorithms can be applied to almost any data problem:

  • Linear Regression
  • Logistic Regression
  • Decision Tree
  • SVM
  • Naive Bayes
  • KNN
  • K-Means
  • Random Forest
  • Dimensionality Reduction Algorithms
  • Gradient Boosting algorithms
    • GBM
    • XGBoost
    • LightGBM
    • CatBoost

1. Linear Regression

It is used to estimate real values (cost of houses, number of calls, total sales etc.) based on continuous variable(s). Here, we establish relationship between independent and dependent variables by fitting a best line. This best fit line is known as regression line and represented by a linear equation Y= a *X + b.

The best way to understand linear regression is to relive this experience of childhood. Let us say, you ask a child in fifth grade to arrange people in his class by increasing order of weight, without asking them their weights! What do you think the child will do? He / she would likely look (visually analyze) at the height and build of people and arrange them using a combination of these visible parameters. This is linear regression in real life! The child has actually figured out that height and build would be correlated to the weight by a relationship, which looks like the equation above.

In this equation:

  • Y – Dependent Variable
  • a – Slope
  • X – Independent variable
  • b – Intercept

These coefficients a and b are derived based on minimizing the sum of squared difference of distance between data points and regression line.

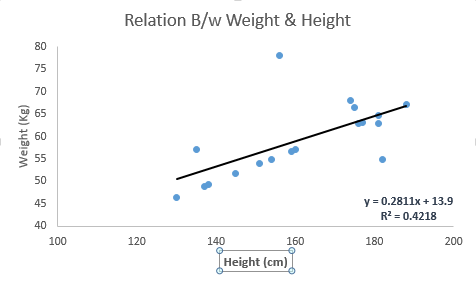
Look at the below example. Here we have identified the best fit line having linear equation y=0.2811x+13.9. Now using this equation, we can find the weight, knowing the height of a person.

Linear Regression is of mainly two types: Simple Linear Regression and Multiple Linear Regression. Simple Linear Regression is characterized by one independent variable. And, Multiple Linear Regression(as the name suggests) is characterized by multiple (more than 1) independent variables. While finding best fit line, you can fit a polynomial or curvilinear regression. And these are known as polynomial or curvilinear regression.

Python Code

  1. #Import Library#Import other necessary libraries like pandas, numpy...
复制代码


R Code

  1. #Load Train and Test datasets#Identify feature and response variable(s) and values must be numeric and numpy arraysx_train <- input_variables_values_training_datasetsy_train <- target_variables_values_training_datasetsx_test <- input_variables_values_test_datasetsx <- cbind(x_train,y_train)# Train the model using the training sets and check scorelinear <- lm(y_train ~ ., data = x)summary(linear)#Predict Outputpredicted= predict(linear,x_test)
复制代码

2. Logistic Regression

Don’t get confused by its name! It is a classification not a regression algorithm. It is used to estimate discrete values ( Binary values like 0/1, yes/no, true/false ) based on given set of independent variable(s). In simple words, it predicts the probability of occurrence of an event by fitting data to a logit function. Hence, it is also known as logit regression. Since, it predicts the probability, its output values lies between 0 and 1 (as expected).

Again, let us try and understand this through a simple example.

Let’s say your friend gives you a puzzle to solve. There are only 2 outcome scenarios – either you solve it or you don’t. Now imagine, that you are being given wide range of puzzles / quizzes in an attempt to understand which subjects you are good at. The outcome to this study would be something like this – if you are given a trignometry based tenth grade problem, you are 70% likely to solve it. On the other hand, if it is grade fifth history question, the probability of getting an answer is only 30%. This is what Logistic Regression provides you.

Coming to the math, the log odds of the outcome is modeled as a linear combination of the predictor variables.

odds= p/ (1-p) = probability of event occurrence / probability of not event occurrenceln(odds) = ln(p/(1-p))logit(p) = ln(p/(1-p)) = b0+b1X1+b2X2+b3X3....+bkXk

Above, p is the probability of presence of the characteristic of interest. It chooses parameters that maximize the likelihood of observing the sample values rather than that minimize the sum of squared errors (like in ordinary regression).

Now, you may ask, why take a log? For the sake of simplicity, let’s just say that this is one of the best mathematical way to replicate a step function. I can go in more details, but that will beat the purpose of this article.

Python Code

  1. #Import Libraryfrom sklearn.linear_model import LogisticRegression#Assumed you have, X (predictor) and Y (target) for training data set and x_test(predictor) of test_dataset# Create logistic regression objectmodel = LogisticRegression()# Train the model using the training sets and check scoremodel.fit(X, y)model.score(X, y)#Equation coefficient and Interceptprint('Coefficient: \n', model.coef_)print('Intercept: \n', model.intercept_)#Predict Outputpredicted= model.predict(x_test)
复制代码


R Code

  1. x <- cbind(x_train,y_train)# Train the model using the training sets and check scorelogistic <- glm(y_train ~ ., data = x,family='binomial')summary(logistic)#Predict Outputpredicted= predict(logistic,x_test)
复制代码

Furthermore..

There are many different steps that could be tried in order to improve the model:


缺少币币的网友请访问有奖回帖集合
https://bbs.pinggu.org/thread-3990750-1-1.html

使用道具

藤椅
MouJack007 发表于 2018-1-28 09:12:56 |只看作者 |坛友微信交流群
谢谢分享
已有 1 人评分论坛币 收起 理由
oliyiyi + 3 精彩帖子

总评分: 论坛币 + 3   查看全部评分

使用道具

板凳
钱学森64 发表于 2018-1-28 09:18:29 |只看作者 |坛友微信交流群
谢谢分享
已有 1 人评分论坛币 收起 理由
oliyiyi + 3 精彩帖子

总评分: 论坛币 + 3   查看全部评分

使用道具

报纸
minixi 发表于 2018-1-28 12:24:23 |只看作者 |坛友微信交流群
谢谢分享
已有 1 人评分论坛币 收起 理由
oliyiyi + 3 精彩帖子

总评分: 论坛币 + 3   查看全部评分

使用道具

您需要登录后才可以回帖 登录 | 我要注册

本版微信群
加好友,备注jltj
拉您入交流群

京ICP备16021002-2号 京B2-20170662号 京公网安备 11010802022788号 论坛法律顾问:王进律师 知识产权保护声明   免责及隐私声明

GMT+8, 2024-4-25 13:58