楼主: oliyiyi
1516 1

Visualize correlation matrices in Python [推广有奖]

版主

泰斗

0%

还不是VIP/贵宾

-

TA的文库  其他...

计量文库

威望
7
论坛币
271951 个
通用积分
31269.3519
学术水平
1435 点
热心指数
1554 点
信用等级
1345 点
经验
383775 点
帖子
9598
精华
66
在线时间
5468 小时
注册时间
2007-5-21
最后登录
2024-4-18

初级学术勋章 初级热心勋章 初级信用勋章 中级信用勋章 中级学术勋章 中级热心勋章 高级热心勋章 高级学术勋章 高级信用勋章 特级热心勋章 特级学术勋章 特级信用勋章

+2 论坛币
k人 参与回答

经管之家送您一份

应届毕业生专属福利!

求职就业群
赵安豆老师微信:zhaoandou666

经管之家联合CDA

送您一个全额奖学金名额~ !

感谢您参与论坛问题回答

经管之家送您两个论坛币!

+2 论坛币

本帖隐藏的内容

When working with data it is helpful to build a correlation matrix to describe data and the associations between variables. In this article, you learn how to use visualizations for correlation matrices in Python.

Read packages into R library

First we need to read the packages into the Python library:


  1. # Read packages into Python library

  2. import pandas as pd

  3. import numpy as np

  4. )
复制代码

Visualizations for correlation matrix
First let us make a correlation matrix table:

  1. # Create simulated datset in Python:

  2. rs = np.random.RandomState(0)

  3. df = pd.DataFrame(rs.rand(10, 10))

  4. # Create and print correlation matrix:

  5. corr = df.corr()

  6. print(corr)

  7.           0         1         2         3         4         5         6  \

  8. 0  1.000000  0.347533  0.398948  0.455743  0.072914 -0.233402 -0.731222   

  9. 1  0.347533  1.000000 -0.284056  0.571003 -0.285483  0.382480 -0.362842   

  10. 2  0.398948 -0.284056  1.000000 -0.523649  0.152937 -0.139176 -0.092895   

  11. 3  0.455743  0.571003 -0.523649  1.000000 -0.225343 -0.227577 -0.481548   

  12. 4  0.072914 -0.285483  0.152937 -0.225343  1.000000 -0.104438 -0.147477   

  13. 5 -0.233402  0.382480 -0.139176 -0.227577 -0.104438  1.000000 -0.030252   

  14. 6 -0.731222 -0.362842 -0.092895 -0.481548 -0.147477 -0.030252  1.000000   

  15. 7  0.477978  0.642578  0.016266  0.473286 -0.523283  0.417640 -0.494440   

  16. 8 -0.442621  0.252556 -0.434016  0.279258 -0.614603  0.205851  0.381407   

  17. 9  0.015185  0.190047 -0.383585  0.446650 -0.189916  0.095084 -0.353652   


  18.           7         8         9  

  19. 0  0.477978 -0.442621  0.015185  

  20. 1  0.642578  0.252556  0.190047  

  21. 2  0.016266 -0.434016 -0.383585  

  22. 3  0.473286  0.279258  0.446650  

  23. 4 -0.523283 -0.614603 -0.189916  

  24. 5  0.417640  0.205851  0.095084  

  25. 6 -0.494440  0.381407 -0.353652  

  26. 7  1.000000  0.375873  0.417863  

  27. 8  0.375873  1.000000  0.150421  

  28. 9  0.417863  0.150421  1.000000
复制代码

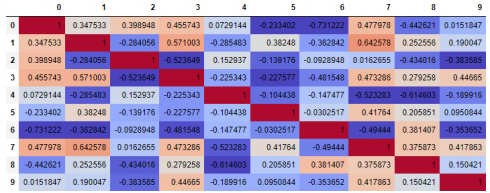
The above table is quite hard to read and you end up with a lot of correlation numbers that is hard to interpret. Let us make them into a correlation matrix visualization:

  1. # 'RdBu_r' & 'BrBG' are other good diverging colormaps

  2. corr.style.background_gradient(cmap='coolwarm')
复制代码

The above coding gives us the following correlation matrix visualization:

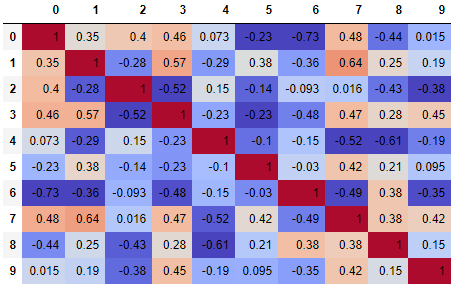
It is possible to limit the digits with the following code:


  1. # Limit number of digits:

  2. corr.style.background_gradient(cmap='coolwarm').set_precision(2)
复制代码

The above coding gives us the following correlation matrix visualization:

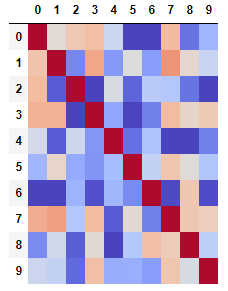
It is also possible not to display digits:

  1. # Without digits:

  2. corr.style.background_gradient(cmap='coolwarm').set_properties(**{'font-size': '0pt'})
复制代码

The above coding gives us the following correlation matrix visualization:

It is also possible to use another colormap:

  1. # Limit number of digits with another colormap:

  2. corr.style.background_gradient(cmap='viridis').set_precision(2)
复制代码

The above coding gives us the following correlation matrix visualization:

And also to highlight numbers:

  1. # Highlight largest number in column:

  2. df.style.highlight_max(axis=0)
复制代码

The above coding gives us the following correlation matrix visualization:

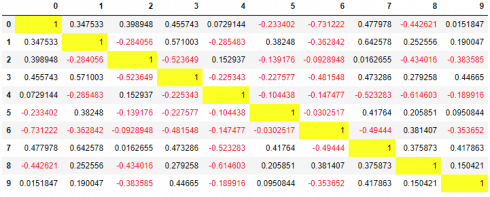
It is also possible to highlight large numbers and color negative number red with the following code:

  1. #Color negative numbers red

  2. def color_negative_red(val):

  3.     """

  4.     Takes a scalar and returns a string with

  5.     the css property `'color: red'` for negative

  6.     strings, black otherwise.

  7.     """

  8.     color = 'red' if val < 0 else 'black'

  9.     return 'color: %s' % color


  10. # Hightlight large numbers

  11. def highlight_max(s):

  12.     '''

  13.     highlight the maximum in a Series yellow.

  14.     '''

  15.     is_max = s == s.max()

  16.     return ['background-color: yellow' if v else '' for v in is_max]

  17. # Create correlation matrix:

  18. rs = np.random.RandomState(0)

  19. df = pd.DataFrame(rs.rand(10, 10))

  20. corr = df.corr()

  21. corr.style.\

  22.     applymap(color_negative_red).\

  23.     apply(highlight_max)
复制代码

The above coding gives us the following correlation matrix:


二维码

扫码加我 拉你入群

请注明:姓名-公司-职位

以便审核进群资格,未注明则拒绝

关键词:correlation Matrices relation matrice matric

缺少币币的网友请访问有奖回帖集合
https://bbs.pinggu.org/thread-3990750-1-1.html
沙发
三重虫 发表于 2021-8-19 19:17:45 |只看作者 |坛友微信交流群

使用道具

您需要登录后才可以回帖 登录 | 我要注册

本版微信群
加好友,备注jltj
拉您入交流群

京ICP备16021002-2号 京B2-20170662号 京公网安备 11010802022788号 论坛法律顾问:王进律师 知识产权保护声明   免责及隐私声明

GMT+8, 2024-4-20 06:48