请选择 进入手机版 | 继续访问电脑版
楼主: 时光人
18856 4

[数据挖掘新闻] 用Python实现经典传染病模型(R0值实时更新) [推广有奖]

  • 3关注
  • 34粉丝

院士

23%

还不是VIP/贵宾

-

威望
1
论坛币
26907 个
通用积分
428.8060
学术水平
95 点
热心指数
109 点
信用等级
91 点
经验
39960 点
帖子
1629
精华
3
在线时间
579 小时
注册时间
2019-2-25
最后登录
2023-4-26

时光人 学生认证  发表于 2020-2-6 09:39:51 |显示全部楼层 |坛友微信交流群
相似文件 换一批

+2 论坛币
k人 参与回答

经管之家送您一份

应届毕业生专属福利!

求职就业群
赵安豆老师微信:zhaoandou666

经管之家联合CDA

送您一个全额奖学金名额~ !

感谢您参与论坛问题回答

经管之家送您两个论坛币!

+2 论坛币


2月5日凌晨更新了SEIRS模型。

2月1日凌晨,根据国家卫建委官网公布的数据实时计算的R0值徘徊在了3.09(Tg=8.4)和3.61附近!R0值第一次出现了下降!详见下图表。

实时更新2019-nCoV基本再生数(R0)值:

基本再生数(R0)的定义:在发病初期,当所有人均为易感者时,一个病人在其平均患病期内所传染的人数。

基于SEIR模型计算的R0值公式如下:


,

v2-cce1a1eba86db4a6a5b19af5d570676e_hd.jpg

R0值Python实现代码如下:


  1. # 此处各参数(p、Tg_1、Tg_2)取值参考其他博客(见文章最后博客链接)

  2. def R0func(defi,susp,t):
  3.     # defi是确诊人数;susp是疑似人数;t是疾病已爆发时间
  4.    
  5.     # p为疑似病例转化为确诊病例的概率
  6.     p = 0.695
  7.     # Tg_1和Tg_2为生成时间(generation period)
  8.     Tg_1 = 8.4
  9.     Tg_2 = 10.0
  10.     # yt为实际预估感染人数
  11.     yt = susp * p + defi
  12.     # lamda为早期指数增长的增长率
  13.     lamda = math.log(yt)/t
  14.    
  15.     R0_1 = 1 + lamda * Tg_1 + p * (1 - p) * pow(lamda * Tg_1,2)
  16.     R0_2 = 1 + lamda * Tg_2 + p * (1 - p) * pow(lamda * Tg_2,2)
  17.    
  18.     return R0_1,R0_2
复制代码


今天是2020年1月27日。根据国家卫生健康委的数据,截至2020年1月26日24时,中国30个省(区、市)累积报告确诊病例2744例,重症病例461例,累计死亡病例80例,累计治愈出院51例,疑似病例5794例,累计追踪密切接触者32799人,当日解除医学观察583人,现有30453人正在接受医学观察。

随着1月23日武汉市宣布全面封城后,各地确诊病例不断出现,2020年的新年因为新型冠状病毒(2019-nCoV)的传播而黯然失色。

本文尝试使用经典传染病模型对2019-nCoV进行建模,预测未来疾病走势。因传染病模型研究属于传染病动力学研究方向,不是本人的工作范围,因此,本人只是将模型中的微分方程,用Python进行实现,想起到抛砖引玉的作用。


(具体各个模型的理论细节,请移步其他文章)

模型一:SI-Model


  1. import scipy.integrate as spi
  2. import numpy as np
  3. import matplotlib.pyplot as plt

  4. # N为人群总数
  5. N = 10000
  6. # β为传染率系数
  7. beta = 0.25
  8. # gamma为恢复率系数
  9. gamma = 0
  10. # I_0为感染者的初始人数
  11. I_0 = 1
  12. # S_0为易感者的初始人数
  13. S_0 = N - I_0
  14. # T为传播时间
  15. T = 150

  16. # INI为初始状态下的数组
  17. INI = (S_0,I_0)


  18. def funcSI(inivalue,_):
  19.     Y = np.zeros(2)
  20.     X = inivalue
  21.     # 易感个体变化
  22.     Y[0] = - (beta * X[0] * X[1]) / N + gamma * X[1]
  23.     # 感染个体变化
  24.     Y[1] = (beta * X[0] * X[1]) / N - gamma * X[1]
  25.     return Y

  26. T_range = np.arange(0,T + 1)

  27. RES = spi.odeint(funcSI,INI,T_range)


  28. plt.plot(RES[:,0],color = 'darkblue',label = 'Susceptible',marker = '.')
  29. plt.plot(RES[:,1],color = 'red',label = 'Infection',marker = '.')
  30. plt.title('SI Model')
  31. plt.legend()
  32. plt.xlabel('Day')
  33. plt.ylabel('Number')
  34. plt.show()
复制代码

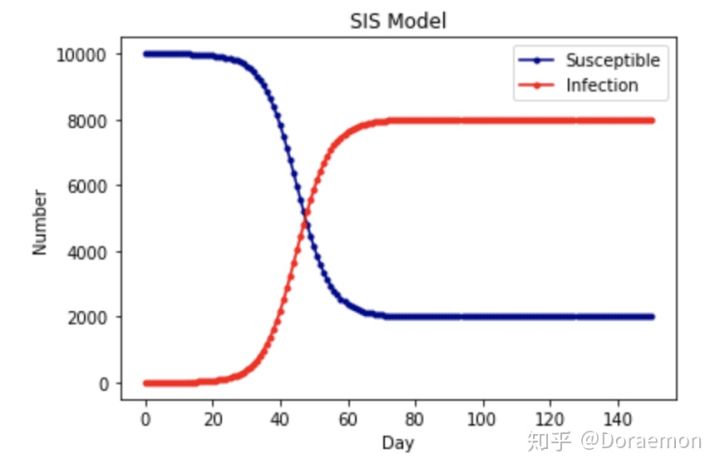
模型二:SIS-Model


  1. import scipy.integrate as spi
  2. import numpy as np
  3. import matplotlib.pyplot as plt

  4. # N为人群总数
  5. N = 10000
  6. # β为传染率系数
  7. beta = 0.25
  8. # gamma为恢复率系数
  9. gamma = 0.05
  10. # I_0为感染者的初始人数
  11. I_0 = 1
  12. # S_0为易感者的初始人数
  13. S_0 = N - I_0
  14. # T为传播时间
  15. T = 150

  16. # INI为初始状态下的数组
  17. INI = (S_0,I_0)


  18. def funcSIS(inivalue,_):
  19.     Y = np.zeros(2)
  20.     X = inivalue
  21.     # 易感个体变化
  22.     Y[0] = - (beta * X[0]) / N * X[1] + gamma * X[1]
  23.     # 感染个体变化
  24.     Y[1] = (beta * X[0] * X[1]) / N - gamma * X[1]
  25.     return Y

  26. T_range = np.arange(0,T + 1)

  27. RES = spi.odeint(funcSIS,INI,T_range)


  28. plt.plot(RES[:,0],color = 'darkblue',label = 'Susceptible',marker = '.')
  29. plt.plot(RES[:,1],color = 'red',label = 'Infection',marker = '.')
  30. plt.title('SIS Model')
  31. plt.legend()
  32. plt.xlabel('Day')
  33. plt.ylabel('Number')
  34. plt.show()
复制代码

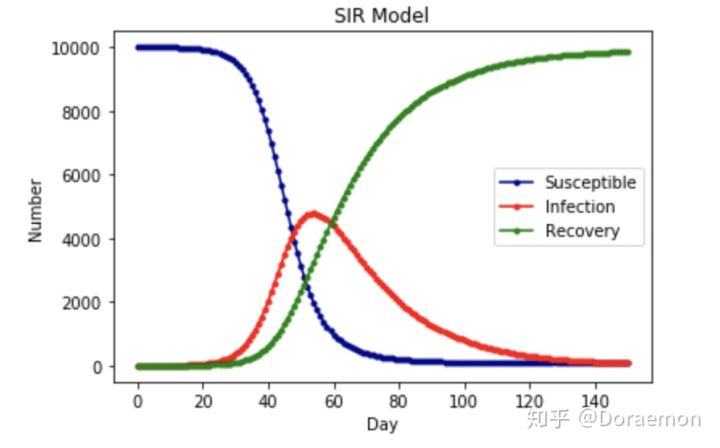
模型三:SIR-Model


  1. import scipy.integrate as spi
  2. import numpy as np
  3. import matplotlib.pyplot as plt

  4. # N为人群总数
  5. N = 10000
  6. # β为传染率系数
  7. beta = 0.25
  8. # gamma为恢复率系数
  9. gamma = 0.05
  10. # I_0为感染者的初始人数
  11. I_0 = 1
  12. # R_0为治愈者的初始人数
  13. R_0 = 0
  14. # S_0为易感者的初始人数
  15. S_0 = N - I_0 - R_0
  16. # T为传播时间
  17. T = 150

  18. # INI为初始状态下的数组
  19. INI = (S_0,I_0,R_0)


  20. def funcSIR(inivalue,_):
  21.     Y = np.zeros(3)
  22.     X = inivalue
  23.     # 易感个体变化
  24.     Y[0] = - (beta * X[0] * X[1]) / N
  25.     # 感染个体变化
  26.     Y[1] = (beta * X[0] * X[1]) / N - gamma * X[1]
  27.     # 治愈个体变化
  28.     Y[2] = gamma * X[1]
  29.     return Y

  30. T_range = np.arange(0,T + 1)

  31. RES = spi.odeint(funcSIR,INI,T_range)


  32. plt.plot(RES[:,0],color = 'darkblue',label = 'Susceptible',marker = '.')
  33. plt.plot(RES[:,1],color = 'red',label = 'Infection',marker = '.')
  34. plt.plot(RES[:,2],color = 'green',label = 'Recovery',marker = '.')
  35. plt.title('SIR Model')
  36. plt.legend()
  37. plt.xlabel('Day')
  38. plt.ylabel('Number')
  39. plt.show()
复制代码

模型四:SIRS-Model


  1. import scipy.integrate as spi
  2. import numpy as np
  3. import matplotlib.pyplot as plt

  4. # N为人群总数
  5. N = 10000
  6. # β为传染率系数
  7. beta = 0.25
  8. # gamma为恢复率系数
  9. gamma = 0.05
  10. # Ts为抗体持续时间
  11. Ts = 7
  12. # I_0为感染者的初始人数
  13. I_0 = 1
  14. # R_0为治愈者的初始人数
  15. R_0 = 0
  16. # S_0为易感者的初始人数
  17. S_0 = N - I_0 - R_0
  18. # T为传播时间
  19. T = 150

  20. # INI为初始状态下的数组
  21. INI = (S_0,I_0,R_0)


  22. def funcSIRS(inivalue,_):
  23.     Y = np.zeros(3)
  24.     X = inivalue
  25.     # 易感个体变化
  26.     Y[0] = - (beta * X[0] * X[1]) / N + X[2] / Ts
  27.     # 感染个体变化
  28.     Y[1] = (beta * X[0] * X[1]) / N - gamma * X[1]
  29.     # 治愈个体变化
  30.     Y[2] = gamma * X[1] - X[2] / Ts
  31.     return Y

  32. T_range = np.arange(0,T + 1)

  33. RES = spi.odeint(funcSIRS,INI,T_range)


  34. plt.plot(RES[:,0],color = 'darkblue',label = 'Susceptible',marker = '.')
  35. plt.plot(RES[:,1],color = 'red',label = 'Infection',marker = '.')
  36. plt.plot(RES[:,2],color = 'green',label = 'Recovery',marker = '.')
  37. plt.title('SIRS Model')
  38. plt.legend()
  39. plt.xlabel('Day')
  40. plt.ylabel('Number')
  41. plt.show()
复制代码

v2-d416aa3e66d8afce1b1ed5499dcd0d51_hd.jpg


二维码

扫码加我 拉你入群

请注明:姓名-公司-职位

以便审核进群资格,未注明则拒绝


v2-205b5ac1a5f636dced59d606edb2d4ca_hd.jpg
已有 1 人评分经验 学术水平 热心指数 信用等级 收起 理由
cheetahfly + 100 + 3 + 3 + 3 精彩帖子

总评分: 经验 + 100  学术水平 + 3  热心指数 + 3  信用等级 + 3   查看全部评分

时光人 学生认证  发表于 2020-2-6 09:40:13 |显示全部楼层 |坛友微信交流群

模型五:SEIR-Model


  1. import scipy.integrate as spi
  2. import numpy as np
  3. import matplotlib.pyplot as plt

  4. # N为人群总数
  5. N = 10000
  6. # β为传染率系数
  7. beta = 0.6
  8. # gamma为恢复率系数
  9. gamma = 0.1
  10. # Te为疾病潜伏期
  11. Te = 14
  12. # I_0为感染者的初始人数
  13. I_0 = 1
  14. # E_0为潜伏者的初始人数
  15. E_0 = 0
  16. # R_0为治愈者的初始人数
  17. R_0 = 0
  18. # S_0为易感者的初始人数
  19. S_0 = N - I_0 - E_0 - R_0
  20. # T为传播时间
  21. T = 150

  22. # INI为初始状态下的数组
  23. INI = (S_0,E_0,I_0,R_0)


  24. def funcSEIR(inivalue,_):
  25.     Y = np.zeros(4)
  26.     X = inivalue
  27.     # 易感个体变化
  28.     Y[0] = - (beta * X[0] * X[2]) / N
  29.     # 潜伏个体变化
  30.     Y[1] = (beta * X[0] * X[2]) / N - X[1] / Te
  31.     # 感染个体变化
  32.     Y[2] = X[1] / Te - gamma * X[2]
  33.     # 治愈个体变化
  34.     Y[3] = gamma * X[2]
  35.     return Y

  36. T_range = np.arange(0,T + 1)

  37. RES = spi.odeint(funcSEIR,INI,T_range)


  38. plt.plot(RES[:,0],color = 'darkblue',label = 'Susceptible',marker = '.')
  39. plt.plot(RES[:,1],color = 'orange',label = 'Exposed',marker = '.')
  40. plt.plot(RES[:,2],color = 'red',label = 'Infection',marker = '.')
  41. plt.plot(RES[:,3],color = 'green',label = 'Recovery',marker = '.')

  42. plt.title('SEIR Model')
  43. plt.legend()
  44. plt.xlabel('Day')
  45. plt.ylabel('Number')
  46. plt.show()
复制代码

模型六:SEIRS-Model


  1. import scipy.integrate as spi
  2. import numpy as np
  3. import matplotlib.pyplot as plt

  4. # N为人群总数
  5. N = 10000
  6. # β为传染率系数
  7. beta = 0.6
  8. # gamma为恢复率系数
  9. gamma = 0.1
  10. # Ts为抗体持续时间
  11. Ts = 7
  12. # Te为疾病潜伏期
  13. Te = 14
  14. # I_0为感染者的初始人数
  15. I_0 = 1
  16. # E_0为潜伏者的初始人数
  17. E_0 = 0
  18. # R_0为治愈者的初始人数
  19. R_0 = 0
  20. # S_0为易感者的初始人数
  21. S_0 = N - I_0 - E_0 - R_0
  22. # T为传播时间
  23. T = 150

  24. # INI为初始状态下的数组
  25. INI = (S_0,E_0,I_0,R_0)


  26. def funcSEIRS(inivalue,_):
  27.     Y = np.zeros(4)
  28.     X = inivalue
  29.     # 易感个体变化
  30.     Y[0] = - (beta * X[0] * X[2]) / N + X[3] / Ts
  31.     # 潜伏个体变化
  32.     Y[1] = (beta * X[0] * X[2]) / N - X[1] / Te
  33.     # 感染个体变化
  34.     Y[2] = X[1] / Te - gamma * X[2]
  35.     # 治愈个体变化
  36.     Y[3] = gamma * X[2] - X[3] / Ts
  37.     return Y

  38. T_range = np.arange(0,T + 1)

  39. RES = spi.odeint(funcSEIRS,INI,T_range)


  40. plt.plot(RES[:,0],color = 'darkblue',label = 'Susceptible',marker = '.')
  41. plt.plot(RES[:,1],color = 'orange',label = 'Exposed',marker = '.')
  42. plt.plot(RES[:,2],color = 'red',label = 'Infection',marker = '.')
  43. plt.plot(RES[:,3],color = 'green',label = 'Recovery',marker = '.')

  44. plt.title('SEIRS Model')
  45. plt.legend()
  46. plt.xlabel('Day')
  47. plt.ylabel('Number')
  48. plt.show()
复制代码

关于2019-nCoV的SEIR模型参数设置不具备参考性,所以做了删除处理。后续时间可能会更改重新放在这里,也可能更新其他模型(如考虑常量输出输入的SEIR模型、SQIR模型等。。。)

因本人以前从未研究过传染病动力学,只是一时感兴趣,所以不免存在问题,欢迎大家指正~

原文链接:https://zhuanlan.zhihu.com/p/104 ... KPQZb8ddyR1vmpyY%3D

使用道具

RyanWen 学生认证  发表于 2020-2-6 17:45:33 来自手机 |显示全部楼层 |坛友微信交流群
优秀

使用道具

tianwk 发表于 2020-2-10 16:49:19 |显示全部楼层 |坛友微信交流群
thanks for sharing

使用道具

cheetahfly 在职认证  发表于 2020-3-1 10:07:22 |显示全部楼层 |坛友微信交流群
非常好,点赞

使用道具

您需要登录后才可以回帖 登录 | 我要注册

本版微信群
加好友,备注cda
拉您进交流群

京ICP备16021002-2号 京B2-20170662号 京公网安备 11010802022788号 论坛法律顾问:王进律师 知识产权保护声明   免责及隐私声明

GMT+8, 2024-3-29 20:44