


 雷达卡
雷达卡


| Useful Economic and Financial Indicators with Links: |
Oil prices |
| WTI | BRENT | Russian Export Blend Crude Oil (REBCO) Futures |
View the full CL00 chart at Wikinvest | View the full SC00 chart at Wikinvest | View the full RE chart at Wikinvest |
Commodities prices and CRB Index |
| ||||||||||||||||||


| Commodities Market Summary | |
 | Gadgets powered by Google |
The Thomson Reuters/Jefferies CRB Index:
View the full CRB chart at Wikinvest
For nearly 50 years, this world-renowned index has served as the most widely recognized measure of global commodities markets. As a benchmark, the Reuters/Jefferies CRB Index is designed to provide timely and accurate representation of a long-only, broadly diversified investment in commodities through a transparent and disciplined calculation methodology. The history of the Reuters/Jefferies CRB Index dates back to 1957, when the Commodity Research Bureau constructed an index comprised of 28 commodities that made its inaugural appearance in the 1958 CRB Commodity Year Book.
It currently is made up of 19 commodities as quoted on the NYMEX, CBOT, LME, CME and COMEX exchanges. These are sorted into 4 groups, each with different weightings. These groups are:
- Petroleum based products (based on their importance to global trade, always make up 33% of the weightings),
- Liquid assets,
- Highly liquid assets
- Diverse commodities
The Index was renamed the Reuters/Jefferies CRB Index in 2005 when it underwent its tenth and most recent revision - as the collaborative effort of Reuters, the global information company, and Jefferies Financial Products, LLC - to maintain its continued accurate representation of modern commodity markets.
See the full details at Jefferies and Reuters
Russian Oil Production: Overview and Data |
Daily Production data are published for free at the Federal State Unitary Enterprise “Central Dispatching Department of Fuel and Energy Complex” (SE "CDU TEK"), while more refined data as well as historical data are available for a fee.
Interesting related websites are reported below:
Russian Federation: Center for Energy Efficient Technology (CERT)
Russian Federation: Coal Industry Advisory Board (CIAB)
Russian Federation: Federal Agency for Science and Innovation
Russian Federation: Federal State Statistics Service
Russian Federation: Gazprom
Russian Federation: Ministry of Energy
Russian Federation: Russian Energy Agency
Russian Federation: Siberian Coal Energy Company (SUEK)
One of the most detailed and interesting analysis about the future prospects of the Russian Oil sector is the diploma thesis by Aram Mäkivierikko (from the the Uppsala Hydrocarbon Depletion Study Group of the Swedish Uppsala University) titled "Russian Oil - A Depletion Rate Model estimate of the future Russian oil production and export". published at the beginning of 2007. Find below the abstract:
Abstract: Oil is a heavily used natural resource with a limited supply. Russia is one of the largest oil producers and the second largest oil exporting country in the world. Many surrounding countries are dependent on Russian energy. Swedish oil import from Russia has grown from 5% to 35% during 2001-2005. The fall of the Soviet Union in 1991 caused the Russian oil production to drop by 50%. The production is currently growing again – but how will it develop in the future? This report studies different scenarios for Russian oil production and export based on three different estimates of how much oil Russia has left today (70, 120 or 170 Gb), combined with estimates about how fast Russia can produce the oil (a depletion rate of 3%, 4.5% or 6%). In the worst case, Russian oil production and also the oil export will peak very soon or has already done so in 2006. In the best case, a constant export can be held until 2036. It is not likely that the Russian production will increase more than 5-10% over today’s level.
|
Crude oil stock levels is one of the many factors affecting the price of crude oil, and recently one of the most looked at, in order to understand the level of oil supply and scarcity.
See the EIA-DOE Short-Term Energy Outlook for a broader discussion. I report below both the onshore stock and the offshore (floating) storage levels. See also this nice introduction to the World Oil Market posted at Tutor2u.net .
Anyway, the best introduction to the oil industry and markets is surely the book OIL 101 by Morgan Downey (see one the most complete review of this book at "The Oil Drum", as well as Wikipedia). Published at the beginning of 2009, this book has quickly become a benchmark worlwide for its clarity about the oil industry: sufficient to say that in 1 year on Amazon, it has received so far 40 five-star review and 1 four-star review! Definitely, one of the best book ever published in this field.
For daily information and discussions about oil and energy issues in general and their impact on society, the Oil Drum is a must. The Oil Drum was rated one of the top five sustainability blogs of 2007 by Nielsen Netratings and it is one of the most read web site/blog about oil and energy issues, according to Alexa.com and Technorati.com . See also Wikipedia for more details.
U.S. Crude Oil Stocks (billions of barrels -chart from Bloomberg L.P.)

U.S. Crude Oil Stocks (millions of barrels -chart from US EIA-DOE)

US Gulf Coast floating storage (thousands of barrels -chart from Bloomberg L.P.)

For an analysis of the current and future situation of the oil market see the most recent Global Markets Research report by Deutsche Bank, issued on the 22/12/2010, as well as the
report produced by the Technology and Policy Assessment function of the UK Energy Research Centre issued at the end of 2009 .
Gasoline Prices |
(Data and charts from EIA-DOE)


For data and more details see here.
US Monthly Crude Oil and Natural Gas Exploratory and Development Wells |
(Data and charts from EIA-DOE)
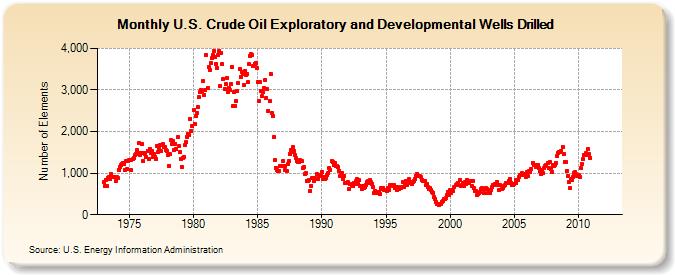

For data and more details see here.
US Annual Real Cost of Crude Oil and Natural Gas Wells Drilled |


For data and more details see here.
Monthly US Percent Utilization of Refinery Operable Capacity |

For data and more details see here.
Monthly US Rotary Rigs in Operation |


For data and more details see here..
US Crude Oil Input Quality |


For data and more details see here.
Finally, for more information about the previous charts from EIA-DOE and the underlying material, see again the outstanding book "Oil 101" by Morgan Downey.
Baltic Exchange Indices |
The exchange publishes six daily indices:
- Baltic Dry Index (BDI)Baltic Panamax Index (BPI) Baltic Capesize Index (BCI) Baltic Supramax Index (BSI) Baltic Handysize Index (BHSI) Baltic Dirty Tanker Index (BDTI)
- Baltic Clean Tanker Index (BCTI)
The Baltic Dry Index (BDI) is a number issued daily by the London-based Baltic Exchange. Not restricted to Baltic Sea countries, the index tracks worldwide international shipping prices of various dry bulk cargoes. The index provides "...an assessment of the price of moving the major raw materials by sea. Taking in 26 shipping routes measured on a timecharter and voyage basis, the index covers Handymax, Panamax, and Capesize dry bulk carriers carrying a range of commodities including coal, iron ore and grain.(from the official Baltic Exchange web page)".
Every working day, a panel of international shipbrokers submits their view of current freight cost on various routes to the Baltic Exchange. The routes are meant to be representative, i.e. large enough in volume to matter for the overall market. These rate assessments are then weigthed together to create both the overall BDI and the sizespecific Supramax, Panamax, , Capesize and Handysize indices. See Wikipedia and Wikinvest for more details.
Index type vessel size BCI bulk carrier 172,000 dwt iron ore, coal BPI bulk carrier 74,000 dwt coal, grain BSI bulk carrier 52,000 dwt grain, fertilizer, coal etc. BHSI bulk carrier 28,000 dwt steel, fertilizer, grain etc. BDTI tanker 105-300,000 dwt crude oil BCTI tanker 22-75,000 dwt oil products BLPG gas tanker 57,000 cbm LPG, butane, methane Palm Oil veg oil tanker 47,000 dwt palm oil ConTex container vessel 1100-2500 teu container HAX container vessel 299-3400 teu container SCFI container 20' container containerised goods
cargo
(Note 1: Deadweight tonnage -often abbreviated as DWT for deadweight tonnes- is the displacement at any loaded condition minus the lightship weight. It includes the crew, passengers, cargo, fuel, water, and stores. It is often expressed in long tons or in metric tons. See "Tonnage" in Wikipedia fore more details.
Note 2: The twenty-foot equivalent unit (often TEU or teu) is an inexact unit of cargo capacity often used to describe the capacity of container ships and container terminals. It is based on the volume of a 20-foot-long (6.1 m) intermodal container, a standard-sized metal box which can be easily transferred between different modes of transportation, such as ships, trains and trucks. See Wikipedia for details.
Note 3: cbm in this case stands for cubic meter.)
BALTIC DRY INDEX
View the full BDIY chart at Wikinvest
Baltic Dry Index (chart from Bloomberg L.P.)

Baltic Dirty Tanker Index (chart from Bloomberg L.P.)

Baltic Clean Tanker Index (chart from Bloomberg L.P.)

For the latest quotes and some interactive charts about the BDI and other Baltic Exchange daily indexes see here.
Bunkerworld Indices |
(The previous description and the chart below are taken from the official webpage at http://www.bunkerworld.com)

Bunkerworld Distillate Index (BWDI): "The BWDI is a combined daily average dollar value index of MDO (marine diesel oil) and MGO (marine gasoil) distillate fuels from the same 20 key bunkering ports used to calculate the BWI (Bunkerworld Index). To obtain a representative geographical spread, the ports were selected by size with reference to their geographical importance. The BWDI Index is transparent, independently calculated and based on the accurate and highly regarded Bunkerworld Benchmark Prices (BBP). The BBP is set for each port every day at a certain time and is included in the Index. The BWDI Index, as a whole, is set daily at 18:00 GMT. The BWDI represents the fundamentals for distillate fuel market price changes and is a versatile vehicle. It gives you access to market movements without the need to analyse multiple port price shifts. It can also be regarded as an international barometer of the distillate fuel markets and could be useful as a basis for setting distillate fuel futures, swaps or OTC contracts, as well as providing an independent basis for the calculation of fuel surcharges."
(The previous description and the chart below are taken from the official webpage at http://www.bunkerworld.com)

Other Tanker Indices and Ship Tracking Services |
- Vesseltracker.com : With more than 210,000 registered users, and over 1,000,000 visitors each month vesseltracker.com is the leading Automatic Identification System (AIS) data provider. This website offers online resources for satellite and terrestrial tracking solutions. They also offer additional data such as schedules, expected arrivals and vessel master data (description taken from its official website). It has a nice Google Earth plug in, which is free with delayed data. The AIS is an automated tracking system used on ships and by Vessel Traffic Services (VTS) for identifying and locating vessels by electronically exchanging data with other nearby ships and VTS stations. AIS information supplements marine radar, which continues to be the primary method of collision avoidance for water transport (see Wikipedia for more details)
- Lloyd's List Intelligence: it is a specialist business information service dedicated to the global maritime community. With a history of collecting maritime data dating back nearly 300 years, Lloyd's List Intelligence provides an interactive online service offering detailed vessel movements, real-time AIS positioning, comprehensive information on ships, companies, ports and casualties as well as credit reports, industry data and analysis including short-term market outlook reports. Lloyd's List Intelligence also provides a range of support services such as in-depth consultancy, investigations, due diligence, market trend analysis and credit risk appraisal for entire portfolios. See also Wikipedia for more details.
- Simpson Spencer Young (SSY): it is one of the world's largest independent shipbroking group, covering fourteen countries and offers a comprehensive range of services including, Dry Cargo Chartering, Tanker Chartering, Sale & Purchase, Freight Futures, Agency & Towage, Consultancy & Research, Chemical Tanker Chartering etc. If offers a lot of free charts and other interesting links about the shipping industry.
Vix Index |
View the full VIX chart at Wikinvest
Real Time Key Financial Ratios (Over a 3-year sample) + Long Term Historical Charts |
- DOW/GOLD RATIO : http://stockcharts.com/h-sc/ui?s=$INDU:$GOLD&p=D&yr=3&mn=0&dy=0&id=p33713745883
LONG TERM HISTORICAL CHARTS: DOW GOLD RATIO
(Charts from goldprice.org)
36 years - Dow Gold Ratio.
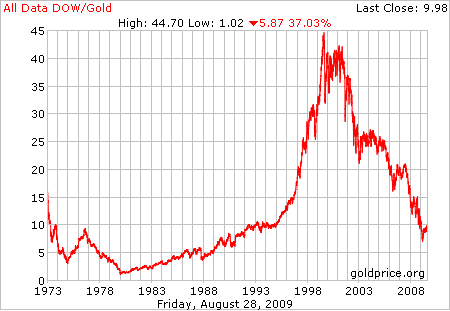
80 years - Dow Gold Ratio.
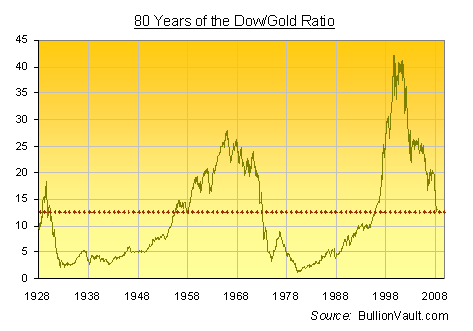
200 years - Dow Gold Ratio (Source: http://www.sharelynx.com )

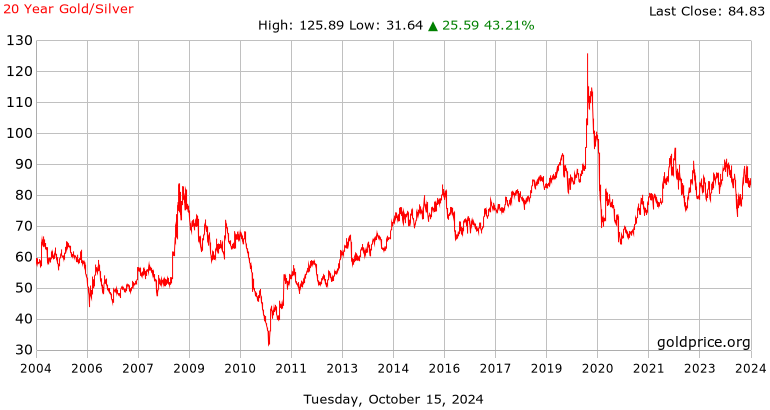
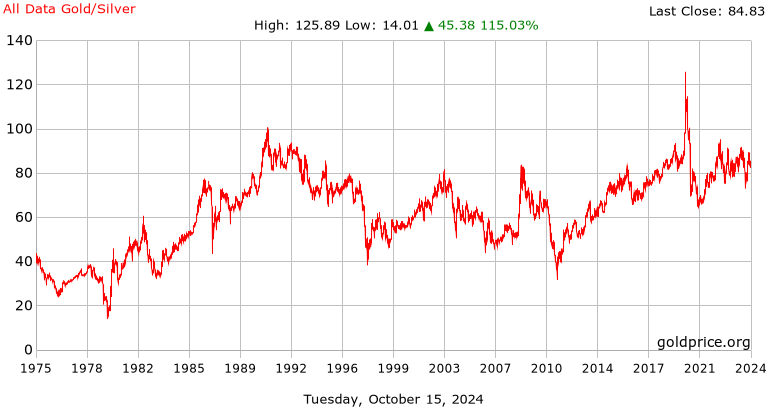
- GOLD/SILVER RATIO : http://stockcharts.com/h-sc/ui?s=$GOLD:$SILVER&p=W&yr=3&mn=0&dy=0&id=p91852955167
LONG TERM HISTORICAL CHARTS: GOLD SILVER RATIO
(Charts from goldprice.org)
20 year gold silver ratio
36 year gold silver ratio
LONG TERM HISTORICAL CHARTS: GOLD OIL RATIO
(Chart from gold-eagle.com)

Individuals receiving FOOD STAMPS in the US |

(Note: The annual chart above uses the federal government’s fiscal year, which begins in October).
Individuals receiving Food Stamps in the US (Monthly data
reported by United States Department of Agriculture)

Food stamps data: Montlly data by the USDA Annual data by the USDA
Employment Index by Monster.com |
(Charts from www.dailyjobsupdate.com)


Due to the seasonality in hiring, the year-over-year growth rate is the preferred measure. We remark that Monster publishes a lot more detailed data,
broken down by country, city, industry, etc. See here for more details
ECRI Weekly Leading Index |
(Chart from www.businesscycle.com )

Philly Fed's Aruoba-Diebold-Scotti Business Conditions Index (ADS) |
It is based on six underlying data series (see more details here):
- Weekly initial jobless claims
- Monthly payroll employment
- Industrial production
- Personal income less transfer payments
- Manufacturing and trade sales
- Quarterly real GDP
(Chart from www.philadelphiafed.org )

Chicago Fed's National Activity Index (CFNAI) |
- Production and income
- Employment, unemployment and hours worked
- Personal consumption and housing
- Sales, orders and inventories
(Chart from www.chicagofed.org )

Let's see a comparison of the three indexes as proposed by the website dshort.com where the data are adjusted with a 3-month moving average (to make the chart easier to read):

The most complete (and updated) US debt clock can be found here
| US National Debt | |
| Gadgets powered by Google |
| US Largest Budget Items | |
| Gadgets powered by Google |
| US Population / Employment Clock | |
| Gadgets powered by Google |
The debt clock for each US state can be found below:
The Financial Forecast Center |
I report below some of their forecasts for sake of interest, but refer to their official webpage for much more information.
SP500 Forecast WTI Oil Price Forecast US Dollar to Euro Exchange Rate Forecast


Economic Calendar |
| Forex Economic Calendar | |
| Gadgets powered by Google |
Currency Informer (Belarus,Russia, Ukraine) |
| Currency informer | |
| Gadgets powered by Google |
Currencies (Ranks, Flat rates, Cross Rates, Changes, Historical) |
| CURRENCIES | |
| Gadgets powered by Google |
Commodities and Futures (Energy, Metals, Grains, Livestock,Softs) |
| COMMODITIES AND FUTURES | |
| Gadgets powered by Google |
FAO Food Price Index and Commodities Price Indices |


FFinancial Times News |
| Financial Times | |
| Gadgets powered by Google |
Google News |
| Google News | |
| Gadgets powered by Google |
Bloomberg News Podcasts |
| Bloomberg News Podcasts | |
| Gadgets powered by Google |
Futures (Global Summary) |
| _Futures_ | |
| Gadgets powered by Google |
Macroaxis Symbol Search |
| Macroaxis Symbol Search | |
| Gadgets powered by Google |
Market Movers |
| Market Movers | |
| Gadgets powered by Google |
SP500 Chart |
| S&P 500 Chart | |
| Gadgets powered by Google |
World Indices (Americas, Europe, Asia/Pacific, Africa/Mid. East) |
| World Indices | |
| Gadgets powered by Google |
Intraday World Market Summary/font> |
| Intraday Word Market Summary | |
| Gadgets powered by Google |
Car Sector Summary |
| Car Sector Summary | |
| Gadgets powered by Google |
Real Time Forex Charts |
| Real Time Forex Charts | |
| Gadgets powered by Google |
Real Time Company News |
| Real-time Company News | |
| Gadgets powered by Google |
Real Time chart Ruble/USD |
Gadgets powered by GoogleWell, that's all for today...but check the weather before coming back home!
| Погода России, weather Russia, meteo forecast Russia | |
| Gadgets powered by Google |
(DISCLAIMER / FAIR USE NOTICE: This site contains copyrighted material the use of which has not always been specifically authorized by the copyright owner. I am making such material available in my efforts to advance understanding of economic, financial and scientific issues among my university students. I believe this constitutes a 'fair use' of any such copyrighted material as provided for in section 107 of the US Copyright Law. In accordance with Title 17 U.S.C. Section 107, the material on this site is distributed without profit to those who have expressed a prior interest in receiving the included information for research and educational purposes. For more information go to:
http://www.law.cornell.edu/uscode/17/107.shtml.
If you wish to use copyrighted material from this site for purposes of your own that go beyond 'fair use', you must obtain permission from the copyright owner. If you are the owner of an image and want it removed, please email me and I will do so as soon as possible.)
[/table]
|

|


 京公网安备 11010802022788号


