


 雷达卡
雷达卡


使用场景说明
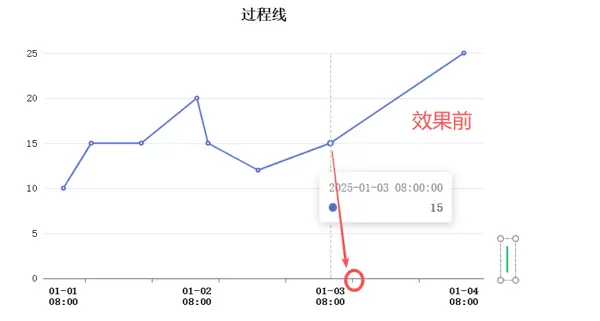
在进行 ECharts 图表开发时,遇到一个关于时间轴显示的问题:当折线图的 X 轴类型设置为 time 时,系统默认将刻度对齐到每日的【年-月-日 00:00】时刻。然而,在实际业务中,我的数据关键时间点是每天早上 08:00,例如【年-月-日 08:00】,导致图表上的刻度线无法准确反映这些重要时间节点。
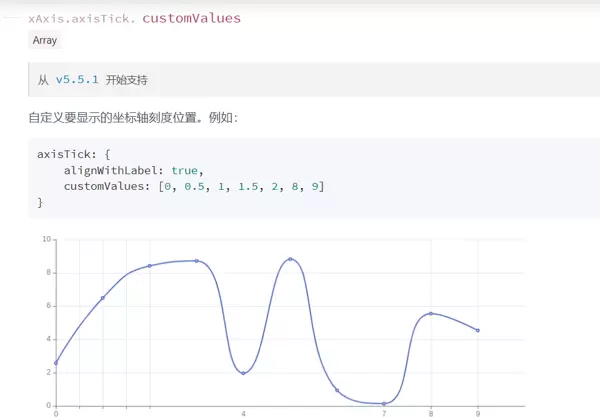
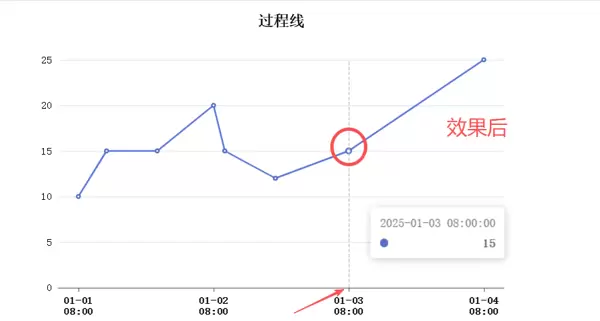
为了解决这一问题,尝试了多种方式,包括搜索 DeepSeek、豆包、百度等平台的相关技术资料,但均未找到有效解决方案。最终在查阅 ECharts 官方文档时,发现了 xAxis.axisTick.customValues 这一配置项,通过手动指定刻度位置,成功实现了自定义时间点的对齐。
由于目前网络上缺少对此功能的详细记录与案例分享,特此整理实现过程和代码示例,供后续开发者参考。
核心配置解析
以下是对关键配置项的说明:
- xAxis.type = 'time':启用时间轴模式,自动解析时间格式数据。
- boundaryGap:设置坐标轴两端空白策略,避免数据贴边。
- axisLabel.formatter:用于格式化 X 轴标签的显示内容,此处按“月-日”换行“时:分”的形式展示,并特别标识包含 08:00 的标签。
- axisTick.customValues:这是解决问题的核心属性,允许传入一个时间戳数组,强制刻度线出现在指定的时间点上。
完整配置代码
let option = {
    textStyle: {
        fontFamily: '宋体',
        color: '#000000'
    },
    title: {
        left: 'center',
        top: '10px',
        text: '过程线',
        textStyle: {
            fontWeight: "700",
            color: '#000000'
        }
    },
    legend: {
        top: '40px',
        textStyle: {
            fontWeight: "700",
            color: '#000000',
            fontFamily: '宋体'
        }
    },
    grid: {
        top: '70px',
        left: '6%',
        right: '6%',
        bottom: '15%'
    },
    tooltip: {
        trigger: 'axis'
    },
    xAxis: {
        type: 'time',
        boundaryGap: [0.05, 0.05],
        axisLabel: {
            alignWithLabel: true,
            color: "#000",
            fontWeight: 700,
            formatter: function (value) {
                const date = new Date(value);
                let year = date.getFullYear();
                let month = (date.getMonth() + 1).toString().padStart(2, '0');
                let day = date.getDate().toString().padStart(2, '0');
                let hours = date.getHours().toString().padStart(2, '0');
                let minutes = date.getMinutes().toString().padStart(2, '0');
                let xval = (month + '-' + day) + '\n' + (hours + ':' + minutes);
                if (xval.indexOf('08:00') > -1) {
                    return xval;
                }
            }
        },
        customValues: [
            new Date('2025-01-01 08:00').getTime(),
            new Date('2025-01-02 08:00').getTime(),
            new Date('2025-01-03 08:00').getTime(),
            new Date('2025-01-04 08:00').getTime()
        ]
    },
    axisTick: {
        alignWithLabel: true,
        customValues: [
            new Date('2025-01-01 08:00').getTime(),
            new Date('2025-01-02 08:00').getTime(),
            new Date('2025-01-03 08:00').getTime(),
            new Date('2025-01-04 08:00').getTime()
        ]
    },
    yAxis: {
        type: 'value'
    },
    series: [
        {
            data: [
                [new Date('2025-01-01 08:00').getTime(), 10],
                [new Date('2025-01-01 13:00').getTime(), 15],
                [new Date('2025-01-01 22:00').getTime(), 15],
                [new Date('2025-01-02 08:00').getTime(), 20],
                [new Date('2025-01-02 10:00').getTime(), 15]
            ],
            type: 'line'
        }
    ]
};
官方文档参考
更多关于 axisTick.customValues 的详细说明,请访问 ECharts 官网配置手册:
https://echarts.apache.org/zh/option.html#xAxis.axisTick.customValues
以下是处理后的内容:
图表配置数据如下:
[
  [new Date('2025-01-02 19:00').getTime(), 12],
  [new Date('2025-01-03 08:00').getTime(), 15],
  [new Date('2025-01-04 08:00').getTime(), 25]
],
type: 'line'
}
]
};
展示效果示意:
其他相关视觉呈现:

 京公网安备 11010802022788号


