原文:It's a Big Data Jungle Out There
"Every now and then, we find ourselves in new and unexpected places."
As these words were spoken by Analise Polsky, a thought leader on the SAS Best Practices team delivering the closing session at this week's Big Data Conference in Chicago, I looked around the room. Pretty much all the audience members seemed to be nodding to themselves absolutely in agreement. That's because it is surely true, especially in the context of the new world of big data.
Polsky herself readily admitted that working for an analytics software company and being immersed in big data was not a destination she imagined for herself as an undergraduate studying anthropology. But neither did she expect to find herself living deep in the Amazon jungle. Oddly enough, she found her inner data geek amid those towering trees -- and what she wouldn't have given to have the advantages of today's visual data tools out there in the field.
In fact, that trip into the Amazon serves as the perfect metaphor for the big data journey. "I remember looking back at the city and watching the lights fade away and seeing this thickening dark row of trees getting taller and taller until there was only darkness and thinking, 'How am I going to survive this?'"
Certainly, that unease is relatable to anybody grappling with crazy amounts and new varieties of data approaching at rapid speed. Polsky said she shares her story of the Amazon because it reflects the way many people feel about big data -- that overwhelming sense of being in the dark and unable to see the trees. "We need to think of big data in a way that makes sense to people who aren't just the data junkies."
Data visualization, which popped up as an important consideration time and again among conference speakers and participants, is essential, she said. "How do we make data consumable? I truly believe that data visualization is going to be even more important going forward, and it's going to be how you're going to tell your organization's data story."
With 70 percent of all sensory receptors in the eyes, data visualization is really the only way people are going to be able to see the trees. It not only will help simplify complex ideas and clarify trends and outliers, but it also will help justify business decisions. "Once we can see, we can understand."
And if your organization is building a data-driven, analytically oriented culture, data visualization provides a great way to foster collaboration. It's a mode of communication, and it provides a way to speak a common language around your data. But there's a caveat : "You have to be speaking the same language."
Say the Southeast region comprises nine states according to sales but 10 in marketing's eyes. A data visualization showing the 11 states that finance considers the Southeast region will be ineffective for the sales and marketing teams. The data has to be consistent -- no different than ever but more vividly captured in a data visualization. "You have to establish accountability around the data. Data visualizations are the output, but people need to know they can trust the data and rely on it."
Just as Polsky had to prepare for her trip into the Amazon -- learning Portuguese, for example -- so must today's analytics professionals as they move into the unchartered territory of big data. Question everything , she advised:
- Do you know what the problem is? "Data visualizations should confirm a hypothesis or answer a question. We don't want to spend a lot of time searching for something with no tie-in back to business challenge."
- Can you act on it? "Exploration is great, analysis is great, but what am I supposed to do about it?"
- Can your data help address the problem? You should recognize that data sometimes won't be the answer. Talent, for example, isn't a data problem; it's an HR problem.
- Who's using the data, and how will they benefit from the visuals? "The benefit has to be driven by a purpose. We're not just talking about reports. We need to monitor information. I work with a lot of data stewards. They need to monitor; they need to see when rules are violated. Visuals help."
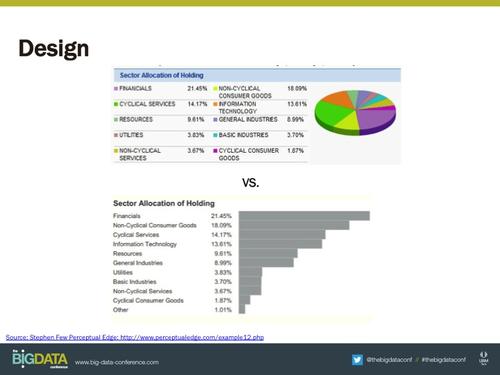
- Do they need special skills? Sometimes your visuals will require a graphic designer. "Design does matter. Color matters. The layout matters. It changes our perception."
 A graphic designer could keep you from making visual mistakes, like using an ineffective
3D pie chart to deliver critical business information.
But data visualization shouldn't boil down to a features and function conversation. It should be about evolution. "So ask the right questions. And don't be afraid to ask additional questions you couldn't before, and let visualizations be one of the ways you get people to the table."
Do you find yourself not being able to see the trees through the big data jungle at your organization? Share your experiences below.


 雷达卡
雷达卡


 京公网安备 11010802022788号


