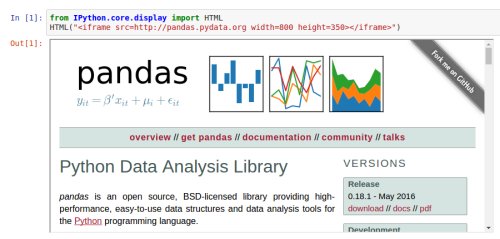
This tutorial will introduce the use of Python for statistical data analysis, using data stored as Pandas DataFrame objects, taking the form of a set of IPython notebooks.
By Christopher Fonnesbeck, Vanderbilt University School of Medicine.
DescriptionEditor's note: This tutorial was originally published as course instructional material, and may contain out-of-context references to other courses therein; this takes nothing away from the validity or usefulness of the material.
This tutorial will introduce the use of Python for statistical data analysis, using data stored as Pandas DataFrame objects. Much of the work involved in analyzing data resides in importing, cleaning and transforming data in preparation for analysis. Therefore, the first half of the course is comprised of a 2-part overview of basic and intermediate Pandas usage that will show how to effectively manipulate datasets in memory. This includes tasks like indexing, alignment, join/merge methods, date/time types, and handling of missing data. Next, we will cover plotting and visualization using Pandas and Matplotlib, focusing on creating effective visual representations of your data, while avoiding common pitfalls. Finally, participants will be introduced to methods for statistical data modeling using some of the advanced functions in Numpy, Scipy and Pandas. This will include fitting your data to probability distributions, estimating relationships among variables using linear and non-linear models, and a brief introduction to bootstrapping methods. Each section of the tutorial will involve hands-on manipulation and analysis of sample datasets, to be provided to attendees in advance.

The target audience for the tutorial includes all new Python users, though we recommend that users also attend the NumPy and IPython session in the introductory track.
Student Instructions
For students familiar with Git, you may simply clone this repository to obtain all the materials (iPython notebooks and data) for the tutorial. Alternatively, you may download a zip file containing the materials. A third option is to simply view static notebooks by clicking on the titles of each section below.
- Importing data
- Series and DataFrame objects
- Indexing, data selection and subsetting
- Hierarchical indexing
- Reading and writing files
- Sorting and ranking
- Missing data
- Data summarization
- Date/time types
- Merging and joining DataFrame objects
- Concatenation
- Reshaping DataFrame objects
- Pivoting
- Data transformation
- Permutation and sampling
- Data aggregation and GroupBy operations
- Plotting in Pandas vs Matplotlib
- Bar plots
- Histograms
- Box plots
- Grouped plots
- Scatterplots
- Trellis plots
- Statistical modeling
- Fitting data to probability distributions
- Fitting regression models
- Model selection
- Bootstrapping
- Python 2.7 or higher (including Python 3)
- pandas >= 0.11.1 and its dependencies
- NumPy >= 1.6.1
- matplotlib >= 1.0.0
- pytz
- IPython >= 0.12
- pyzmq
- tornado
Optional: statsmodels, xlrd and openpyxl
For students running the latest version of Mac OS X (10.8), the easiest way to obtain all the packages is to install the Scipy Superpack which works with Python 2.7.2 that ships with OS X.
Otherwise, another easy way to install all the necessary packages is to use Continuum Analytics' Anaconda.
Statistical Reading List
The Ecological Detective: Confronting Models with Data, Ray Hilborn and Marc Mangel
Though targeted to ecologists, Mangel and Hilborn identify key methods that scientists can use to build useful and credible models for their data. They don't shy away from the math, but the book is very readable and example-laden.
Data Analysis Using Regression and Multilevel/Hierarchical Models, Andrew Gelman and Jennifer Hill
The go-to reference for applied hierarchical modeling.
The Elements of Statistical Learning, Hastie, Tibshirani and Friedman
A comprehensive machine learning guide for statisticians.
A First Course in Bayesian Statistical Methods, Peter Hoff
An excellent, approachable book to get started with Bayesian methods.
Regression Modeling Strategies, Frank Harrell
Frank Harrell's bag of tricks for regression modeling. I pull this off the shelf every week.
Bio: Christopher Fonnesbeck is an Assistant Professor in the Department of Biostatistics at the Vanderbilt University School of Medicine. He specializes in computational statistics, Bayesian methods, meta-analysis, and applied decision analysis. He originally hails from Vancouver, BC and received his Ph.D. from the University of Georgia.


 雷达卡
雷达卡


 京公网安备 11010802022788号


