


 雷达卡
雷达卡


A few years ago, Scott Fortmann-Roe wrote a great essay titled "Understanding the Bias-Variance Tradeoff."
As data science morphs into an accepted profession with its own set of tools, procedures, workflows, etc., there often seems to be less of a focus on statistical processes in favor of the more exciting aspects (see here and here for a pair of example discussions).
Conceptual Definitions
While this will serve as an overview of Scott's essay, which you can read for further detail and mathematical insights, we will start by with Fortmann-Roe's verbatim definitions which are central to the piece:
Error due to Bias: The error due to bias is taken as the difference between the expected (or average) prediction of our model and the correct value which we are trying to predict. Of course you only have one model so talking about expected or average prediction values might seem a little strange. However, imagine you could repeat the whole model building process more than once: each time you gather new data and run a new analysis creating a new model. Due to randomness in the underlying data sets, the resulting models will have a range of predictions. Bias measures how far off in general these models' predictions are from the correct value.
Error due to Variance: The error due to variance is taken as the variability of a model prediction for a given data point. Again, imagine you can repeat the entire model building process multiple times. The variance is how much the predictions for a given point vary between different realizations of the model.
Essentially, bias is how removed a model's predictions are from correctness, while variance is the degree to which these predictions vary between model iterations.
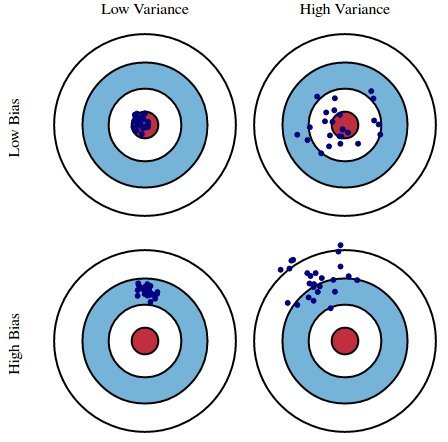
Fig. 1: Graphical illustration of bias and variance
From Understanding the Bias-Variance Tradeoff, by Scott Fortmann-Roe.
Discussion
Using a simple flawed Presidential election survey as an example, errors in the survey are then explained through the twin lenses of bias and variance: selecting survey participants from a phonebook is a source of bias; a small sample size is a source of variance; minimizing total model error relies on the balancing of bias and variance errors.
Fortmann-Roe then goes on to discuss these issues as they relate to a single algorithm: k-Nearest Neighbor. He then provides some key issues to think about when managing bias and variance, including re-sampling techniques, asymptotic properties of algorithms and their effect on bias and variance errors, and fighting one's assumptions vis-a-vis both data and its modeling.
The essay ends contending that, at their heart, these 2 concepts are tightly linked to both over- and under-fitting. In my opinion, here is the most important point:
As more and more parameters are added to a model, the complexity of the model rises and variance becomes our primary concern while bias steadily falls. For example, as more polynomial terms are added to a linear regression, the greater the resulting model's complexity will be. In other words, bias has a negative first-order derivative in response to model complexity while variance has a positive slope.
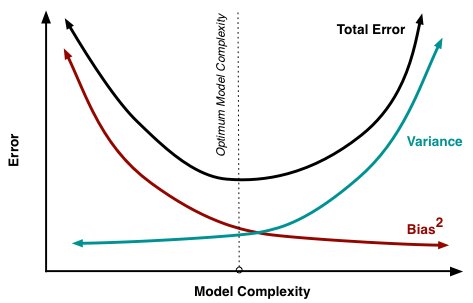
Fig. 2: Bias and variance contributing to total error
From Understanding the Bias-Variance Tradeoff, by Scott Fortmann-Roe.
Fortmann-Roe ends the section on over- and under-fitting by pointing to another of his great essays (Accurately Measuring Model Prediction Error), and then moving on to the highly-agreeable recommendation that "resampling based measures such as cross-validation should be preferred over theoretical measures such as Aikake's Information Criteria."

Fig. 3: 5-Fold cross-validation data split
From Accurately Measuring Model Prediction Error, by Scott Fortmann-Roe.
Of course, with cross-validation, the number of folds to use (k-fold cross-validation, right?), the value of k is an important decision. The lower the value, the higher the bias in the error estimates and the less variance. Conversely, when k is set equal to the number of instances, the error estimate is then very low in bias but has the possibility of high variance. The bias-variance tradeoff is clearly important to understand for even the most routine of statistical evaluation methods, such as k-fold cross-validation.
Unfortunately, cross-validation also seems, at times, to have lost its allure in the modern age of data science, but that is a discussion for another time.

 京公网安备 11010802022788号


