请选择 进入手机版 | 继续访问电脑版
楼主: jasonwu24
4421 16

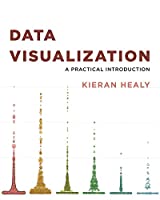
[书籍介绍] 【普林斯顿大学数据可视化】Data Visualization: A Practical Introduction [推广有奖]

  • 5关注
  • 43粉丝

讲师

98%

还不是VIP/贵宾

-

威望
0
论坛币
58348 个
通用积分
245.4454
学术水平
119 点
热心指数
114 点
信用等级
85 点
经验
22677 点
帖子
344
精华
1
在线时间
505 小时
注册时间
2015-2-15
最后登录
2022-11-18

jasonwu24 在职认证  发表于 2019-7-16 11:23:44 |显示全部楼层 |坛友微信交流群
相似文件 换一批

+2 论坛币
k人 参与回答

经管之家送您一份

应届毕业生专属福利!

求职就业群
赵安豆老师微信:zhaoandou666

经管之家联合CDA

送您一个全额奖学金名额~ !

感谢您参与论坛问题回答

经管之家送您两个论坛币!

+2 论坛币
  • Title: Data Visualization: A Practical Introduction
  • Author: Kieran Healy
  • Length: 296 pages
  • Edition: 1
  • Language: English
  • Publisher: Princeton University Press
  • Publication Date: 2018-12-18
  • ISBN-10: 0691181616
  • ISBN-13: 9780691181615


Data.Visualization_A.Practical.Introduction.2019.pdf (12.15 MB, 需要: 5 个论坛币)


An accessible primer on how to create effective graphics from data


This book provides students and researchers a hands-on introduction to the principles and practice of data visualization. It explains what makes some graphs succeed while others fail, how to make high-quality figures from data using powerful and reproducible methods, and how to think about data visualization in an honest and effective way.

Data Visualization builds the reader’s expertise in ggplot2, a versatile visualization library for the R programming language. Through a series of worked examples, this accessible primer then demonstrates how to create plots piece by piece, beginning with summaries of single variables and moving on to more complex graphics. Topics include plotting continuous and categorical variables; layering information on graphics; producing effective “small multiple” plots; grouping, summarizing, and transforming data for plotting; creating maps; working with the output of statistical models; and refining plots to make them more comprehensible.


Effective graphics are essential to communicating ideas and a great way to better understand data. This book provides the practical skills students and practitioners need to visualize quantitative data and get the most out of their research findings.


  • Provides hands-on instruction using R and ggplot2

  • Shows how the “tidyverse” of data analysis tools makes working with R easier and more consistent

  • Includes a library of data sets, code, and functions


二维码

扫码加我 拉你入群

请注明:姓名-公司-职位

以便审核进群资格,未注明则拒绝

关键词:introduction troduction Practical practic 普林斯顿大学

已有 5 人评分经验 论坛币 学术水平 热心指数 信用等级 收起 理由
sdzy + 5 + 5 + 5 + 5 精彩帖子
cheetahfly + 30 奖励积极上传好的资料
dxystata + 50 + 20 + 1 奖励积极上传好的资料
Stakiny + 3 + 3 + 3 精彩帖子
hoozoo + 1 + 1 + 1 奖励积极上传好的资料

总评分: 经验 + 50  论坛币 + 55  学术水平 + 9  热心指数 + 10  信用等级 + 9   查看全部评分

waterhorse 发表于 2019-7-17 02:48:19 |显示全部楼层 |坛友微信交流群
多谢分享.

使用道具

yangming98 发表于 2019-7-17 23:02:05 来自手机 |显示全部楼层 |坛友微信交流群
jasonwu24 发表于 2019-7-16 11:23
  • Title: Data Visualization: A Practical Introduction
  • Author: Kieran Healy
  • Length: 296 pa ...
  • 好的好的好的好的好的

    使用道具

    cheetahfly 在职认证  发表于 2019-7-21 09:00:19 |显示全部楼层 |坛友微信交流群
    多谢分享

    使用道具

    jjxm20060807 发表于 2019-7-23 22:55:44 |显示全部楼层 |坛友微信交流群
    谢谢分享

    使用道具

    smartvoice 发表于 2019-7-24 17:17:57 |显示全部楼层 |坛友微信交流群
    好东西,谢谢分享。

    使用道具

    tianwk 发表于 2019-7-25 15:54:36 |显示全部楼层 |坛友微信交流群
    thanks for sharing

    使用道具

    jasonwu24 在职认证  发表于 2020-3-10 16:43:44 |显示全部楼层 |坛友微信交流群
    链接:https://pan.baidu.com/s/1f-z_Yz3nrCHtze05jTJ6eQ
    提取码:ddf6

    使用道具

    wwgf 发表于 2020-4-21 05:07:14 |显示全部楼层 |坛友微信交流群
    jasonwu24 发表于 2020-3-10 16:43
    链接:https://pan.baidu.com/s/1f-z_Yz3nrCHtze05jTJ6eQ
    提取码:ddf6
    谢谢分享!

    使用道具

    lonestone 在职认证  发表于 2020-4-21 06:23:27 来自手机 |显示全部楼层 |坛友微信交流群
    jasonwu24 发表于 2019-7-16 11:23
  • Title: Data Visualization: A Practical Introduction
  • Author: Kieran Healy
  • Length: 296 pa ...
  • 谢谢楼主的分享

    使用道具

    您需要登录后才可以回帖 登录 | 我要注册

    本版微信群
    加好友,备注cda
    拉您进交流群

    京ICP备16021002-2号 京B2-20170662号 京公网安备 11010802022788号 论坛法律顾问:王进律师 知识产权保护声明   免责及隐私声明

    GMT+8, 2024-3-29 08:30