


 雷达卡
雷达卡


- R语言代码及结果
summary(model5)
Linear mixed-effects model fit by REML
Data: data0
AIC BIC logLik
43022.08 43072.77 -21504.04
Random effects:
Formula: ~gevocab | school
Structure: General positive-definite, Log-Cholesky parametrization
StdDev Corr
(Intercept) 0.532288 (Intr)
gevocab 0.138951 -0.857
Residual 1.914660
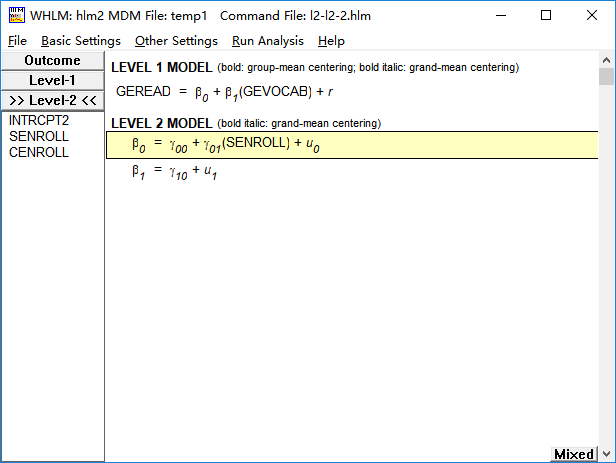
Fixed effects: geread ~ gevocab + senroll
Value Std.Error DF t-value p-value
(Intercept) 1.9955373 0.11824650 10159 16.87608 0.0000
gevocab 0.5203485 0.01442894 10159 36.06284 0.0000
senroll 0.0000202 0.00019597 158 0.10298 0.9181
Correlation:
(Intr) gevocb
gevocab -0.483
senroll -0.856 0.041
Standardized Within-Group Residuals:
Min Q1 Med Q3 Max
-3.7101558 -0.5671411 -0.2069899 0.3176373 4.6764282
Number of Observations: 10320
Number of Groups: 160
- HLM操作过程及结果
Final estimation of fixed effects
(with robust standard errors)
----------------------------------------------------------------------------
Standard Approx.
Fixed Effect Coefficient Error T-ratio d.f. P-value
----------------------------------------------------------------------------
For INTRCPT1, B0
INTRCPT2, G00 1.995620 0.102811 19.411 158 0.000
SENROLL, G01 0.000020 0.000178 0.113 158 0.911
For GEVOCAB slope, B1
INTRCPT2, G10 0.520344 0.014306 36.373 159 0.000
----------------------------------------------------------------------------
Final estimation of variance components:
-----------------------------------------------------------------------------
Random Effect Standard Variance df Chi-square P-value
Deviation Component
-----------------------------------------------------------------------------
INTRCPT1, U0 0.53298 0.28407 158 312.89252 0.000
GEVOCAB slope, U1 0.13897 0.01931 159 449.57347 0.000
level-1, R 1.91464 3.66586
-----------------------------------------------------------------------------
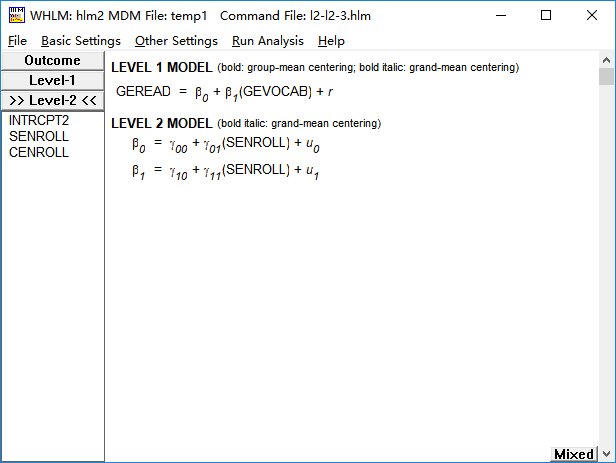
(3)第一层自变量与第二层自变量的交互作用
- R语言代码及结果
summary(model6)
Linear mixed-effects model fit by REML
Data: data0
AIC BIC logLik
43040.59 43098.52 -21512.29
Random effects:
Formula: ~gevocab | school
Structure: General positive-definite, Log-Cholesky parametrization
StdDev Corr
(Intercept) 0.5327945 (Intr)
gevocab 0.1391362 -0.857
Residual 1.9146996
Fixed effects: geread ~ gevocab + senroll + gevocab * senroll
Value Std.Error DF t-value p-value
(Intercept) 1.9103629 0.20955353 10158 9.116348 0.0000
gevocab 0.5430546 0.04833711 10158 11.234734 0.0000
senroll 0.0001886 0.00039427 158 0.478456 0.6330
gevocab:senroll -0.0000452 0.00009191 10158 -0.492225 0.6226
Correlation:
(Intr) gevocb senrll
gevocab -0.869
senroll -0.956 0.834
gevocab:senroll 0.825 -0.954 -0.868
Standardized Within-Group Residuals:
Min Q1 Med Q3 Max
-3.7062482 -0.5678540 -0.2080792 0.3184771 4.6822679
Number of Observations: 10320
Number of Groups: 160
- HLM6.08操作步骤及结果
Final estimation of fixed effects
(with robust standard errors)
----------------------------------------------------------------------------
Standard Approx.
Fixed Effect Coefficient Error T-ratio d.f. P-value
----------------------------------------------------------------------------
For INTRCPT1, B0
INTRCPT2, G00 1.910416 0.215980 8.845 158 0.000
SENROLL, G01 0.000188 0.000427 0.441 158 0.659
For GEVOCAB slope, B1
INTRCPT2, G10 0.543052 0.053060 10.235 158 0.000
SENROLL, G11 -0.000045 0.000103 -0.437 158 0.662
----------------------------------------------------------------------------
Final estimation of variance components:
-----------------------------------------------------------------------------
Random Effect Standard Variance df Chi-square P-value
Deviation Component
-----------------------------------------------------------------------------
INTRCPT1, U0 0.53334 0.28445 158 311.68917 0.000
GEVOCAB slope, U1 0.13919 0.01937 158 445.56073 0.000
level-1, R 1.91470 3.66606
-----------------------------------------------------------------------------
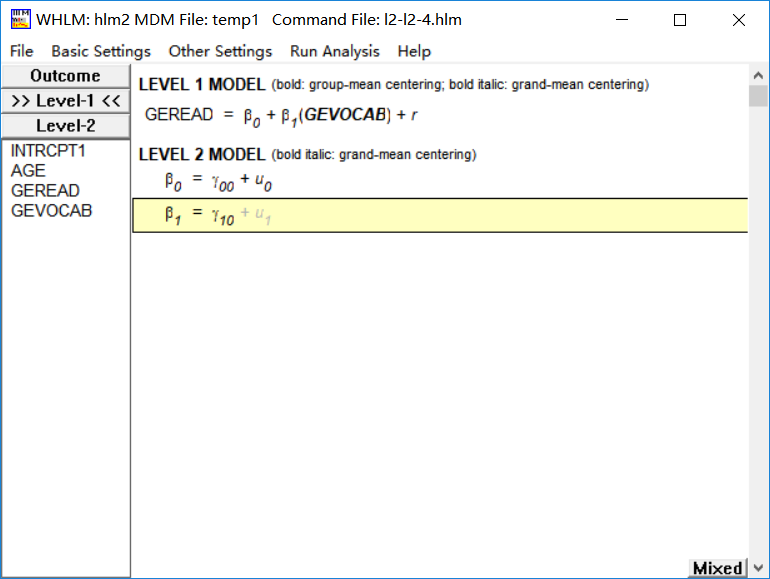
1.2.4 第一层添加自变量(中心化)的两层模型
在HLM6.08中,变量中心化的方式有两种:group centered 和 grand centered。对于一列可分组数据,grand centered是指每个数据减去该列数据均值后产生的新数据;group centered是指每个数据减去所在组均值后产生的新数据。在软件窗口中容易发现,未中心化的变量名称不加粗,grand centered的变量名称斜体加粗,group centered的变量名称加粗
(1)grand centered
- R语言代码及结果
model7 <- lme(fixed = geread~grandc_gevocab, random = ~1|school, data = data0)
summary(model7)
Linear mixed-effects model fit by REML
Data: data0
AIC BIC logLik
43145.2 43174.17 -21568.6
Random effects:
Formula: ~1 | school
(Intercept) Residual
StdDev: 0.3158785 1.94074
Fixed effects: geread ~ grandc_gevocab
Value Std.Error DF t-value p-value
(Intercept) 4.328238 0.03214212 10159 134.6594 0
grandc_gevocab 0.512898 0.00837268 10159 61.2585 0
Correlation:
(Intr)
grandc_gevocab 0.007
Standardized Within-Group Residuals:
Min Q1 Med Q3 Max
-3.0822506 -0.5734728 -0.2103488 0.3206692 4.4334337
Number of Observations: 10320
Number of Groups: 160
- HLM6.08操作步骤及结果
Final estimation of fixed effects
(with robust standard errors)
----------------------------------------------------------------------------
Standard Approx.
Fixed Effect Coefficient Error T-ratio d.f. P-value
----------------------------------------------------------------------------
For INTRCPT1, B0
INTRCPT2, G00 4.328238 0.032185 134.480 159 0.000
For GEVOCAB slope, B1
INTRCPT2, G10 0.512897 0.015608 32.861 10318 0.000
----------------------------------------------------------------------------
Final estimation of variance components:
-----------------------------------------------------------------------------
Random Effect Standard Variance df Chi-square P-value
Deviation Component
-----------------------------------------------------------------------------
INTRCPT1, U0 0.31589 0.09978 159 434.42829 0.000
level-1, R 1.94074 3.76647
-----------------------------------------------------------------------------
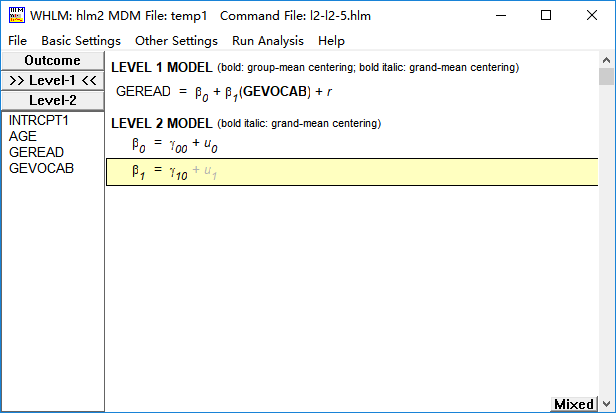
(2)group centered
- R语言代码及结果
data1 <- merge(data0, groupc, by.x = "school", by.y = "Group.1")
groupc_gevocab <- data1$gevocab-data1$x
model8 <- lme(fixed = geread~groupc_gevocab, random = ~1|school, data = data1)
summary(model8)
Linear mixed-effects model fit by REML
Data: data1
AIC BIC logLik
43313.61 43342.58 -21652.81
Random effects:
Formula: ~1 | school
(Intercept) Residual
StdDev: 0.6430152 1.940787
Fixed effects: geread ~ groupc_gevocab
Value Std.Error DF t-value p-value
(Intercept) 4.305162 0.05494456 10159 78.35465 0
groupc_gevocab 0.502820 0.00856086 10159 58.73469 0
Correlation:
(Intr)
groupc_gevocab 0
Standardized Within-Group Residuals:
Min Q1 Med Q3 Max
-3.0737302 -0.5738781 -0.2084442 0.3247135 4.4634255
Number of Observations: 10320
Number of Groups: 160
- HLM6.08操作步骤及结果
Final estimation of fixed effects
(with robust standard errors)
----------------------------------------------------------------------------
Standard Approx.
Fixed Effect Coefficient Error T-ratio d.f. P-value
----------------------------------------------------------------------------
For INTRCPT1, B0
INTRCPT2, G00 4.305162 0.054772 78.602 159 0.000
For GEVOCAB slope, B1
INTRCPT2, G10 0.502820 0.016033 31.362 10318 0.000
----------------------------------------------------------------------------
Final estimation of variance components:
-----------------------------------------------------------------------------
Random Effect Standard Variance df Chi-square P-value
Deviation Component
-----------------------------------------------------------------------------
INTRCPT1, U0 0.64300 0.41345 159 1292.05483 0.000
level-1, R 1.94079 3.76665
-----------------------------------------------------------------------------

 京公网安备 11010802022788号


