


 雷达卡
雷达卡


In the battle of "best" data science tools, python and R both have their pros and cons. Selecting one over the other will depend on the use-cases, the cost of learning, and other common tools required.
By Martijn Theuwissen, DataCamp.At DataCamp, our students often ask us whether they should use R and/or Python for their day-to-day data analysis tasks. Although we mainly offer interactive R tutorials, we always answer that this choice depends on the type of data analytical challenge that they are facing.
Both Python and R are popular programming languages for statistics. While R’s functionality is developed with statisticians in mind (think of R's strong data visualization capabilities!), Python is often praised for its easy-to-understand syntax.
In this post, we will highlight some of the differences between R and Python, and how they both have a place in the data science and statistics world. If you prefer a visual representation, make sure to check out the corresponding infographic ”Data Science Wars: R vs Python”.
Introducing R
Ross Ihaka and Robert Gentleman created the open-source language R in 1995 as an implementation of the S programming language. The purpose was to develop a language that focused on delivering a better and more user-friendly way to do data analysis, statistics and graphical models. At first, R was primarily used in academics and research, but lately the enterprise world is discovering R as well. This makes R one of the fastest growing statistical languages in the corporate world.
One of the main strengths of R is its huge community that provides support through mailing lists, user-contributed documentation and a very active Stack Overflow group. There is also CRAN, a huge repository of curated R packages to which users can easily contribute. These packages are a collection of R functions and data that make it easy to immediately get access to the latest techniques and functionalities without needing to develop everything from scratch yourself.
To end, if you’re an experienced programmer, you probably won't have a hard time to get up to speed with R. As a beginner, however, you might find yourself struggling with the steep learning curve. Luckily, there are many great learning resources you can consult nowadays.
Introducing Python
Python was created by Guido Van Rossem in 1991 and emphasizes productivity and code readability. Programmers that want to delve into data analysis or apply statistical techniques are some of the main users of Python for statistical purposes.
The closer you get to working in an engineering environment, the more likely it is you might prefer Python. It’s a flexible language that is great to do something novel, and given its focus on readability and simplicity, its learning curve is relatively low.
Similar to R, Python has packages as well. PyPi is the Python Package index and consists of libraries to which users can contribute. Just like R, Python has a great community but it is a bit more scattered, since it’s a general purpose language. Nevertheless, Python for data science is rapidly claiming a more dominant position in the Python universe: the expectations are growing and more innovative data science applications will see their origin here.
R and Python: The General Numbers
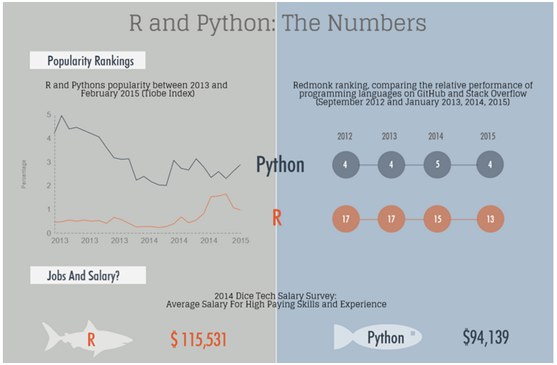
On the web, you can find many numbers comparing the adoption and popularity of R and Python. While these figures often give a good indication on how these two languages are evolving in the overall ecosystem of computer science, it’s hard to compare them side-by-side. The main reason for this is that you will find R only in a data science environment; As a general purpose language, Python, on the other hand, is widely used in many fields, such as web development. This often biases the ranking results in favor of Python, while the salaries are affected somewhat negatively.
When and how to use R?
R is mainly used when the data analysis task requires standalone computing or analysis on individual servers. It’s great for exploratory work, and it's handy for almost any type of data analysis because of the huge number of packages and readily usable tests that often provide you with the necessary tools to get up and running quickly. R can even be part of a big data solution.
When getting started with R, a good first step is to install the amazing RStudio IDE. Once this is done, we recommend you to have a look at the following popular packages:
- dplyr, plyr and data.table to easily manipulate packages,
- stringr to manipulate strings,
- zoo to work with regular and irregular time series,
- ggvis, lattice, and ggplot2 to visualize data, and
- caret for machine learning
When and how to use Python?
You can use Python when your data analysis tasks need to be integrated with web apps or if statistics code needs to be incorporated into a production database. Being a fully fledged programming language, it’s a great tool to implement algorithms for production use.
While the infancy of Python packages for data analysis was an issue in the past, this has improved significantly over the years. Make sure to install NumPy /SciPy (scientific computing) and pandas (data manipulation) to make Python usable for data analysis. Also have a look at matplotlib to make graphics, and scikit-learn for machine learning.
Unlike R, Python has no clear “winning” IDE. We recommend you to have a look at Spyder, IPython Notebook and Rodeo to see which one best fits your needs.
R and Python: The Data Science Numbers
If you look at recent polls that focus on programming languages used for data analysis, R often is a clear winner. If you focus specifically on Python and R's data analysis community, a similar pattern appears.
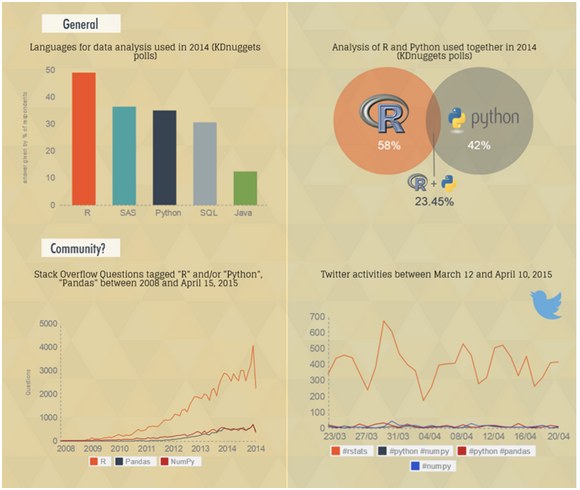
Despite the above figures, there are signals that more people are switching from R to Python. Furthermore, there is a growing group of individuals using a combination of both languages when appropriate. This is exactly in line with what we recommend to our students as well.
If you’re planning to start a career in data science, you are good with both languages. Job trends indicated an increasing demand for both skills, and wages are well above average.
R: Pros and Cons
Pro: A picture says more than a thousands wordsVisualized data can often be understood more efficiently and effectively than the raw numbers alone. R and visualization are a perfect match. Some must-see visualization packages are ggplot2, ggvis, googleVis and rCharts.
Pro: R ecosystemR has a rich ecosystem of cutting-edge packages and active community. Packages are available at CRAN, BioConductor and Github. You can search through all R packages at Rdocumentation.
Pro: R lingua franca of data scienceR is developed by statisticians for statisticians. They can communicate ideas and concepts through R code and packages, you don’t necessarily need a computer science background to get started. Furthermore, it is increasingly adopted outside of academia.
Pro/Con: R is slowR was developed to make the life of statisticians easier, not the life of your computer. Although R can be experienced as slow due to poorly written code, there are multiple packages to improve R’s performance: pqR, renjin and FastR, Riposte and many more.
Con: R has a steep learning curveR’s learning curve is non-trivial, especially if you come from a GUI for your statistical analysis. Even finding packages can be time consuming if you’re not familiar with it.
Python: Pros and Cons
Pro: IPython NotebookThe IPython Notebook makes it easier to work with Python and data. You can easily share notebooks with colleagues, without having them to install anything. This drastically reduces the overhead of organizing code, output and notes files. This will allow you to spend more time doing real work.
Pro: A general purpose languagePython is a general purpose language that is easy and intuitive. This gives it a relatively flat learning curve, and it increases the speed at which you can write a program. In short, you need less time to code and you have more time to play around with it!
Furthermore, the Python testing framework is a built-in, low-barrier-to-entry testing framework that encourages good test coverage. This guarantees your code is reusable and dependable.
Pro: A multi purpose languagePython brings people with different backgrounds together. As a common, easy to understand language that is known by programmers and that can easily be learnt by statisticians, you can build a single tool that integrates with every part of your workflow.
Pro/Con: VisualizationsVisualizations are an important criteria when choosing data analysis software. Although Python has some nice visualization libraries, such as Seaborn, Bokeh and Pygal, there are maybe too many options to choose from. Moreover, compared to R, visualizations are usually more convoluted, and the results are not always so pleasing to the eye.
Con: Python is a challengerPython is a challenger to R. It does not offer an alternative to the hundreds of essential R packages. Although it’s catching up, it’s still unclear if this will make people give up R?
And the winner is..
Up to you! As a data scientist it’s your job to pick the language that best fits the needs. Some questions that can help you:
- What problems do you want to solve?
- What are the net costs for learning a language?
- What are the commonly used tools in your field?
- What are the other available tools and how do these relate to the commonly used tools?
Hope this was useful!
On DataCamp
DataCamp is an online interactive education platform that offers courses in data science and R programming. Each course is built around a certain data science topic, and combines video instruction with in-browser coding challenges so that you can learn by doing. You can start every course for free, whenever you want, wherever you want.


 京公网安备 11010802022788号


