请选择 进入手机版 | 继续访问电脑版
楼主: oliyiyi
1646 4

A Beginner’s Guide to Neural Networks with R [推广有奖]

版主

泰斗

0%

还不是VIP/贵宾

-

TA的文库  其他...

计量文库

威望
7
论坛币
272151 个
通用积分
31269.3519
学术水平
1435 点
热心指数
1554 点
信用等级
1345 点
经验
383775 点
帖子
9598
精华
66
在线时间
5467 小时
注册时间
2007-5-21
最后登录
2024-4-16

初级学术勋章 初级热心勋章 初级信用勋章 中级信用勋章 中级学术勋章 中级热心勋章 高级热心勋章 高级学术勋章 高级信用勋章 特级热心勋章 特级学术勋章 特级信用勋章

oliyiyi 发表于 2016-8-13 18:36:15 |显示全部楼层 |坛友微信交流群

+2 论坛币
k人 参与回答

经管之家送您一份

应届毕业生专属福利!

求职就业群
赵安豆老师微信:zhaoandou666

经管之家联合CDA

送您一个全额奖学金名额~ !

感谢您参与论坛问题回答

经管之家送您两个论坛币!

+2 论坛币

In this article we will learn how Neural Networks work and how to implement them with the R programming language! We will see how we can easily create Neural Networks with R and even visualize them. Basic understanding of R is necessary to understand this article.

By Jose Portilla, Udemy Data Science Instructor.

I'm Jose Portilla and teach thousands of students on Udemy about Data Science and Programming and I also conduct in-person programming and data science training. Check out the end of the article for discount coupons on my courses!

Neural Networks


Neural Networks are a machine learning framework that attempts to mimic the learning pattern of natural biological neural networks. Biological neural networks have interconnected neurons with dendrites that receive inputs, then based on these inputs they produce an output signal through an axon to another neuron. We will try to mimic this process through the use of Artificial Neural Networks (ANN), which we will just refer to as neural networks from now on. The process of creating a neural network begins with the most basic form, a single perceptron.

The Perceptron


Let's start our discussion by talking about the Perceptron! A perceptron has one or more inputs, a bias, an activation function, and a single output. The perceptron receives inputs, multiplies them by some weight, and then passes them into an activation function to produce an output. There are many possible activation functions to choose from, such as the logistic function, a trigonometric function, a step function etc. We also make sure to add a bias to the perceptron, this avoids issues where all inputs could be equal to zero (meaning no multiplicative weight would have an effect). Check out the diagram below for a visualization of a perceptron:
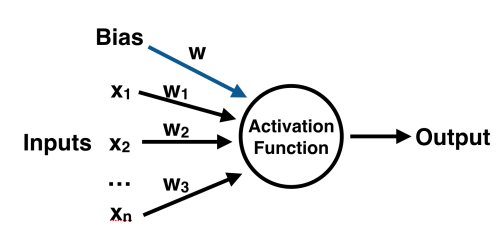


Once we have the output we can compare it to a known label and adjust the weights accordingly (the weights usually start off with random initialization values). We keep repeating this process until we have reached a maximum number of allowed iterations, or an acceptable error rate.

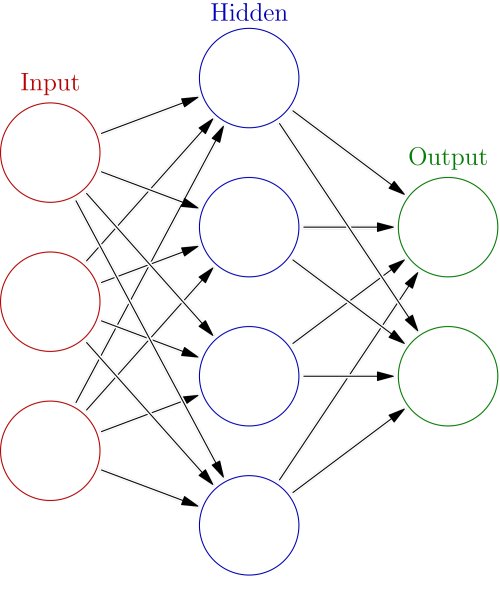
To create a neural network, we simply begin to add layers of perceptrons together, creating a multi-layer perceptron model of a neural network. You'll have an input layer which directly takes in your feature inputs and an output layer which will create the resulting outputs. Any layers in between are known as hidden layers because they don't directly "see" the feature inputs or outputs. For a visualization of this check out the diagram below (source: Wikipedia).


Let's move on to actually creating a neural network in R!

Data


We'll use ISLR's built in College Data Set which has several features of a college and a categorical column indicating whether or not the School is Public or Private.

  1. #install.packages('ISLR')
  2. library(ISLR)

  3. print(head(College,2))
复制代码


                             Private Apps Accept Enroll Top10perc Top25percAbilene Christian University     Yes 1660   1232    721        23        52Adelphi University               Yes 2186   1924    512        16        29                             F.Undergrad P.Undergrad Outstate Room.Board BooksAbilene Christian University        2885         537     7440       3300   450Adelphi University                  2683        1227    12280       6450   750                             Personal PhD Terminal S.F.Ratio perc.alumni ExpendAbilene Christian University     2200  70       78      18.1          12   7041Adelphi University               1500  29       30      12.2          16  10527                             Grad.RateAbilene Christian University        60Adelphi University                  56

Data Preprocessing


It is important to normalize data before training a neural network on it. The neural network may have difficulty converging before the maximum number of iterations allowed if the data is not normalized. There are a lot of different methods for normalization of data. We will use the built-in scale() function in R to easily accomplish this task.

Usually it is better to scale the data from 0 to 1, or -1 to 1. We can specify the center and scale as additional arguments in the scale() function. For example:

  1. # Create Vector of Column Max and Min Values
  2. maxs <- apply(College[,2:18], 2, max)
  3. mins <- apply(College[,2:18], 2, min)

  4. # Use scale() and convert the resulting matrix to a data frame
  5. scaled.data <- as.data.frame(scale(College[,2:18],center = mins, scale = maxs - mins))

  6. # Check out results
  7. print(head(scaled.data,2))
复制代码


                                      Apps        Accept        EnrollAbilene Christian University 0.03288692646 0.04417701272 0.10791253736Adelphi University           0.04384229271 0.07053088583 0.07503539405                                Top10perc    Top25perc   F.UndergradAbilene Christian University 0.2315789474 0.4725274725 0.08716353479Adelphi University           0.1578947368 0.2197802198 0.08075165058                               P.Undergrad     Outstate   Room.BoardAbilene Christian University 0.02454774445 0.2634297521 0.2395964691Adelphi University           0.05614838562 0.5134297521 0.7361286255                                    Books     Personal          PhDAbilene Christian University 0.1577540107 0.2977099237 0.6526315789Adelphi University           0.2914438503 0.1908396947 0.2210526316                                  Terminal    S.F.Ratio perc.alumniAbilene Christian University 0.71052631579 0.4182305630      0.1875Adelphi University           0.07894736842 0.2600536193      0.2500                                   Expend    Grad.RateAbilene Christian University 0.0726714046 0.4629629630Adelphi University           0.1383867137 0.4259259259


二维码

扫码加我 拉你入群

请注明:姓名-公司-职位

以便审核进群资格,未注明则拒绝

关键词:Networks beginner network beginn Neural understand necessary thousands training article

已有 2 人评分经验 学术水平 热心指数 收起 理由
耕耘使者 + 3 + 3 对论坛有贡献
william9225 + 20 精彩帖子

总评分: 经验 + 20  学术水平 + 3  热心指数 + 3   查看全部评分

缺少币币的网友请访问有奖回帖集合
https://bbs.pinggu.org/thread-3990750-1-1.html
oliyiyi 发表于 2016-8-13 18:37:44 |显示全部楼层 |坛友微信交流群
Train and Test Split


Let us now split our data into a training set and a test set. We will run our neural entwork on the training set and then see how well it performed on the test set.

We will use the caTools to randomly split the data into a training set and test set.

  1. # Convert Private column from Yes/No to 1/0
  2. Private = as.numeric(College$Private)-1
  3. data = cbind(Private,scaled.data)

  4. library(caTools)
  5. set.seed(101)

  6. # Create Split (any column is fine)
  7. split = sample.split(data$Private, SplitRatio = 0.70)

  8. # Split based off of split Boolean Vector
  9. train = subset(data, split == TRUE)
  10. test = subset(data, split == FALSE)
复制代码


Neural Network Function


Before we actually call the neuralnetwork() function we need to create a formula to insert into the machine learning model. The neuralnetwork() function won't accept the typical decimal R format for a formula involving all features (e.g. y ~.). However, we can use a simple script to create the expanded formula and save us some typing:

  1. feats <- names(scaled.data)

  2. # Concatenate strings
  3. f <- paste(feats,collapse=' + ')
  4. f <- paste('Private ~',f)

  5. # Convert to formula
  6. f <- as.formula(f)

  7. f
复制代码


Private ~ Apps + Accept + Enroll + Top10perc + Top25perc + F.Undergrad +     P.Undergrad + Outstate + Room.Board + Books + Personal +     PhD + Terminal + S.F.Ratio + perc.alumni + Expend + Grad.Rate

  1. #install.packages('neuralnet')
  2. library(neuralnet)
  3. nn <- neuralnet(f,data,hidden=c(10,10,10),linear.output=FALSE)
复制代码


Predictions and Evaluations


Now let's see how well we performed! We use the compute() function with the test data (jsut the features) to create predicted values. This returns a list from which we can call net.result off of.

  1. # Compute Predictions off Test Set
  2. predicted.nn.values <- compute(nn,test[2:18])

  3. # Check out net.result
  4. print(head(predicted.nn.values$net.result))
复制代码


                                                [,1]Adrian College                          1.0000000000Alfred University                       1.0000000000Allegheny College                       1.0000000000Allentown Coll. of St. Francis de Sales 0.9999999415Alma College                            0.9999999960Amherst College                         0.9994219945

Notice we still have results between 0 and 1 that are more like probabilities of belonging to each class. We'll use sapply() to round these off to either 0 or 1 class so we can evaluate them against the test labels.

  1. predicted.nn.values$net.result <- sapply(predicted.nn.values$net.result,round,digits=0)

  2. Now let's create a simple confusion matrix:
复制代码


  1. table(test$Private,predicted.nn.values$net.result)
复制代码


      0   1  0  62   2  1   0 169

Visualizing the Neural Net


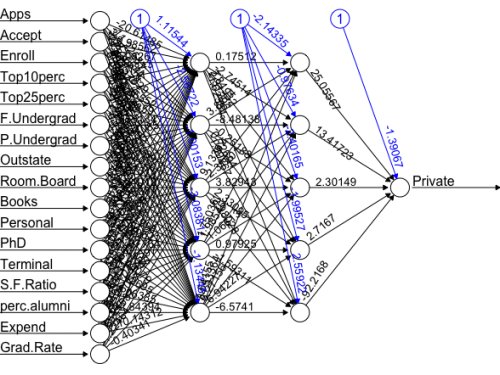
We can visualize the Neural Network by using the plot(nn) command. The black lines represent the weighted vectors between the neurons. The blue line represents the bias added. Unfortunately, even though the model is clearly a very powerful predictor, it is not easy to directly interpret the weights. This means that we usually have to treat Neural Network models more like black boxes.

Hopefully you've enjoyed this brief discussion on Neural Networks! Try playing around with the number of hidden layers and neurons and see how they effect the results!

Want to learn more? You can check out my Data Science and Machine Learning Bootcamp with R course on Udemy! Get it for 50% off at this link: https://www.udemy.com/data-science-and-machine-learning-bootcamp-with-r/?couponCode=KDNUGGETS

If you are looking for corporate in-person training, feel free to contact me at: training AT pieriandata.com

Bio: Jose Portilla is a Data Science consultant and trainer who currently teaches online courses on Udemy. He also conducts training as the Head of Data Science for Pierian Data Inc.


缺少币币的网友请访问有奖回帖集合
https://bbs.pinggu.org/thread-3990750-1-1.html

使用道具

william9225 学生认证  发表于 2016-8-13 22:50:58 来自手机 |显示全部楼层 |坛友微信交流群
谢谢分享
已有 1 人评分经验 收起 理由
oliyiyi + 10 精彩帖子

总评分: 经验 + 10   查看全部评分

使用道具

Kamize 学生认证  发表于 2016-9-2 22:51:48 来自手机 |显示全部楼层 |坛友微信交流群
oliyiyi 发表于 2016-8-13 18:36
In this article we will learn how Neural Networks work and how to implement them with the R programm ...
谢谢分享
已有 1 人评分论坛币 收起 理由
oliyiyi + 5 精彩帖子

总评分: 论坛币 + 5   查看全部评分

使用道具

20115326 学生认证  发表于 2016-10-28 10:12:46 |显示全部楼层 |坛友微信交流群
学习一下,哈哈
已有 1 人评分论坛币 收起 理由
oliyiyi + 5 精彩帖子

总评分: 论坛币 + 5   查看全部评分

使用道具

您需要登录后才可以回帖 登录 | 我要注册

本版微信群
加好友,备注jltj
拉您入交流群

京ICP备16021002-2号 京B2-20170662号 京公网安备 11010802022788号 论坛法律顾问:王进律师 知识产权保护声明   免责及隐私声明

GMT+8, 2024-4-18 09:09