


 雷达卡
雷达卡


Some machine learning algorithms will achieve better performance if your time series data has a consistent scale or distribution.
Two techniques that you can use to consistently rescale your time series data are normalization and standardization.
In this tutorial, you will discover how you can apply normalization and standardization rescaling to your time series data in Python.
After completing this tutorial, you will know:
- The limitations of normalization and expectations of your data for using standardization.
- What parameters are required and how to manually calculate normalized and standardized values.
- How to normalize and standardize your time series data using scikit-learn in Python.
Let’s get started.
[color=rgb(255, 255, 255) !important]
How to Normalize and Standardize Time Series Data in Python
Photo by Sage Ross, some rights reserved.
Minimum Daily Temperatures Dataset
This dataset describes the minimum daily temperatures over 10 years (1981-1990) in the city Melbourne, Australia.
The units are in degrees Celsius and there are 3,650 observations. The source of the data is credited as the Australian Bureau of Meteorology.
Below is a sample of the first 5 rows of data, including the header row.
"Date","Temperatures" "1981-01-01",20.7 "1981-01-02",17.9 "1981-01-03",18.8 "1981-01-04",14.6 "1981-01-05",15.8Below is a plot of the entire dataset taken from Data Market.
[color=rgb(255, 255, 255) !important]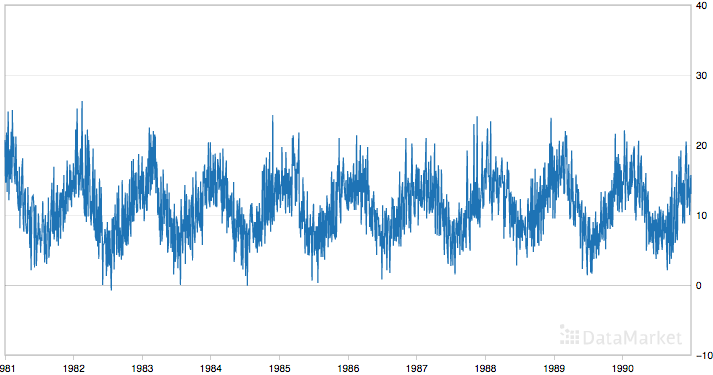
Minimum Daily Temperatures
The dataset shows a strong seasonality component and has a nice, fine-grained detail to work with.
Download and learn more about the dataset here.
This tutorial assumes that the dataset is in your current working directory with the filename “daily-minimum-temperatures-in-me.csv“.
Normalize Time Series DataNormalization is a rescaling of the data from the original range so that all values are within the range of 0 and 1.
Normalization can be useful, and even required in some machine learning algorithms when your time series data has input values with differing scales.It may be required for algorithms, like k-Nearest neighbors, which uses distance calculations and Linear Regression and Artificial Neural Networks that weight input values.
Normalization requires that you know or are able to accurately estimate the minimum and maximum observable values. You may be able to estimate these values from your available data. If your time series is trending up or down, estimating these expected values may be difficult and normalization may not be the best method to use on your problem.
A value is normalized as follows:
y = (x - min) / (max - min)Where the minimum and maximum values pertain to the value x being normalized.
For example, for the temperature data, we could guesstimate the min and max observable values as 30 and -10, which are greatly over and under-estimated. We can then normalize any value like 18.8 as follows:
y = (x - min) / (max - min) y = (18.8 - -10) / (30 - -10) y = 28.8 / 40 y = 0.72You can see that if an x value is provided that is outside the bounds of the minimum and maximum values, that the resulting value will not be in the range of 0 and 1. You could check for these observations prior to making predictions and either remove them from the dataset or limit them to the pre-defined maximum or minimum values.
You can normalize your dataset using the scikit-learn object MinMaxScaler.
Good practice usage with the MinMaxScaler and other rescaling techniques is as follows:
- Fit the scaler using available training data. For normalization, this means the training data will be used to estimate the minimum and maximum observable values. This is done by calling the fit() function,
- Apply the scale to training data. This means you can use the normalized data to train your model. This is done by calling the transform() function
- Apply the scale to data going forward. This means you can prepare new data in the future on which you want to make predictions.
If needed, the transform can be inverted. This is useful for converting predictions back into their original scale for reporting or plotting. This can be done by calling the inverse_transform() function.
Below is an example of normalizing the Minimum Daily Temperatures dataset.
The scaler requires data to be provided as a matrix of rows and columns. The loaded time series data is loaded as a Pandas Series. It must then be reshaped into a matrix of one column with 3,650 rows.
The reshaped dataset is then used to fit the scaler, the dataset is normalized, then the normalization transform is inverted to show the original values again.
# Normalize time series data from pandas import Series from sklearn.preprocessing import MinMaxScaler # load the dataset and print the first 5 rows series = Series.from_csv('daily-minimum-temperatures-in-me.csv', header=0) print(series.head()) # prepare data for normalization values = series.values values = values.reshape((len(values), 1)) # train the normalization scaler = MinMaxScaler(feature_range=(0, 1)) scaler = scaler.fit(values) print('Min: %f, Max: %f' % (scaler.data_min_, scaler.data_max_)) # normalize the dataset and print the first 5 rows normalized = scaler.transform(values) for i in range(5): print(normalized) # inverse transform and print the first 5 rows inversed = scaler.inverse_transform(normalized) for i in range(5): print(inversed)Running the example prints the first 5 rows from the loaded dataset, shows the same 5 values in their normalized form, then the values back in their original scale using the inverse transform.
We can also see that the minimum and maximum values of the dataset are 0 and 26.3 respectively.
Date 1981-01-01 20.7 1981-01-02 17.9 1981-01-03 18.8 1981-01-04 14.6 1981-01-05 15.8 Name: Temp, dtype: float64 Min: 0.000000, Max: 26.300000 [ 0.78707224] [ 0.68060837] [ 0.7148289] [ 0.55513308] [ 0.60076046] [ 20.7] [ 17.9] [ 18.8] [ 14.6] [ 15.8]There is another type of rescaling that is more robust to new values being outside the range of expected values; this is called Standardization. We will look at that next.
Standardize Time Series DataStandardizing a dataset involves rescaling the distribution of values so that the mean of observed values is 0 and the standard deviation is 1.
This can be thought of as subtracting the mean value or centering the data.
Like normalization, standardization can be useful, and even required in some machine learning algorithms when your time series data has input values with differing scales.
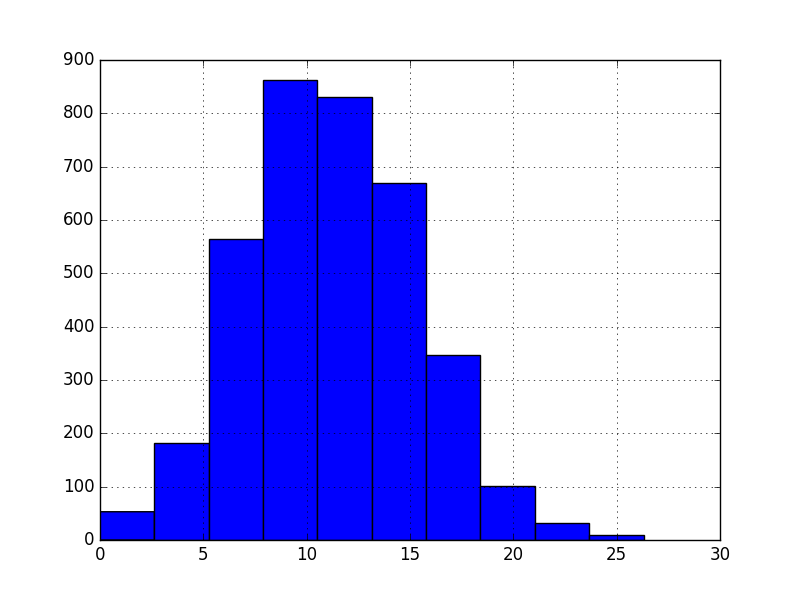
Standardization assumes that your observations fit a Gaussian distribution (bell curve) with a well behaved mean and standard deviation. You can still standardize your time series data if this expectation is not met, but you may not get reliable results.
This includes algorithms like Support Vector Machines, Linear and Logistic Regression, and other algorithms that assume or have improved performance with Gaussian data.
Standardization requires that you know or are able to accurately estimate the mean and standard deviation of observable values. You may be able to estimate these values from your training data.
A value is standardized as follows:
y = (x - mean) / standard_deviationWhere the mean is calculated as:
mean = sum(x) / count(x)And the standard_deviation is calculated as:
standard_deviation = sqrt( sum( (x - mean)^2 ) / count(x))For example, we can plot a histogram of the Minimum Daily Temperatures dataset as follows:
from pandas import Series from matplotlib import pyplot series = Series.from_csv('daily-minimum-temperatures-in-me.csv', header=0) series.hist() pyplot.show() 提升卡
提升卡 置顶卡
置顶卡 沉默卡
沉默卡 变色卡
变色卡 抢沙发
抢沙发 千斤顶
千斤顶 显身卡
显身卡


 京公网安备 11010802022788号


