本帖隐藏的内容
A  new online textbook, Data Visualization for Social Science, will teach you everything you need to know about creating beautiful and elegant data visualizations using the ggplot2 package and the R language. The author Kieran Healy is a professor of Sociology at Duke University who has designed data visualizations featured in outlets like The Washington Post, Vox, The Rachel Maddow Show, Slate, and the Boston Globe.
While the data sets featured in the book are generally from the social sciences, the book nonetheless provides an excellent introduction to visualization with R for any domain. This book is not a general introduction to R, but it does provide a few basics to get you going. And while it doesn't explore all of the possibilities for creating graphics in R, its focus on the ggplot2 package will give you a framework for creating just about any type of statistical graphic you might need, with enough detail to customize it for publication in report, article or presentation.
Here's a brief outline of the 8 chapters of the book:
- Chapter 1: A basic introduction to R. There are a few more details in Appendix A, but if you're completely new to the R language this might not be enough to get you going. You might want to start with something like R for Data Science first: its focus on the Tidyverse dovetails nicely with this book.
- Chapter 2: An example-driven overview of the elements of good (and bad) data visualizations. This chapter has no R-specific content, and is an excellent read for anyone producing statistical graphics.
- Chapter 3: Basics concepts for using the ggplot2 package.
- Chapter 4: Advanced ggplot2 techniques, including groups, facets and transforms.
- Chapter 5: Creating different plot types in ggplot2 using geoms, and how to combine geoms to build up more complex charts.
- Chapter 6: How to visualizing statistical models: including trendlines and smooths, plotting predictions with estimates of variability, and evaluating model fit.
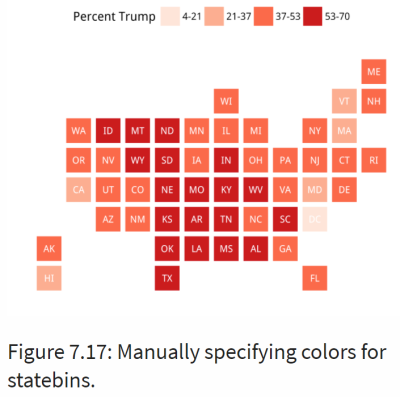
- Chapter 7: Creating geographic maps: aggregating data by regions (like zip code) to create data maps like choropleths and statebins (as shown below).
- Chapter 8: Customizing charts for publication with themes, annotations, and combinations of charts.
While the book is currently marked as an "incomplete draft", the chapters above are all self-contained and include everything you need to learn data visualization with ggplot2 effectively, and feature clear and interesting examples. You can find the book at the link below, and all of the content is free to read online. Hopefully a printed version will also be available for purchase once the content is complete.


 雷达卡
雷达卡


 提升卡
提升卡 置顶卡
置顶卡 沉默卡
沉默卡 变色卡
变色卡 抢沙发
抢沙发 千斤顶
千斤顶 显身卡
显身卡


 京公网安备 11010802022788号


